
15 KiB
IoT စက်ပစ္စည်းမှ စတော့ရှယ်ယာရေတွက်ခြင်း - အိမ်မက်ဆန်သော IoT Hardware နှင့် Raspberry Pi
ပုံတစ်ပုံတွင် စတော့ရှယ်ယာကိုရေတွက်ရန် အကြံပြုချက်များနှင့် bounding boxes တွေကိုပေါင်းစပ်အသုံးပြုနိုင်သည်။
Bounding Boxes ပြသရန်
အကူအညီပေးသော debugging အဆင့်အနေနှင့် bounding boxes တွေကို console မှာသာမက ပုံကို capture လုပ်ပြီး disk မှာရေးသားထားသောပုံပေါ်မှာလည်းဆွဲဆောင်ပြသနိုင်သည်။
Task - bounding boxes ကို console မှာ print လုပ်ပါ
-
stock-counterproject ကို VS Code မှာဖွင့်ထားပြီး၊ virtual IoT device ကိုအသုံးပြုနေပါက virtual environment ကို active လုပ်ထားပါ။ -
forloop ထဲမှာရှိတဲ့printstatement ကို အောက်ပါအတိုင်းပြောင်းလဲပြီး bounding boxes တွေကို console မှာ print လုပ်ပါ:print(f'{prediction.tag_name}:\t{prediction.probability * 100:.2f}%\t{prediction.bounding_box}') -
ကင်မရာကို စတော့ရှယ်ယာရှိသော shelf ကိုညွှန်းထားပြီး app ကို run လုပ်ပါ။ bounding boxes တွေကို console မှာ left, top, width, height values (0-1) အနေနှင့် print လုပ်ပါမည်။
pi@raspberrypi:~/stock-counter $ python3 app.py
tomato paste:   33.42%  {'additional_properties': {}, 'left': 0.3455171, 'top': 0.09916268, 'width': 0.14175442, 'height': 0.29405564}
tomato paste:   34.41%  {'additional_properties': {}, 'left': 0.48283678, 'top': 0.10242918, 'width': 0.11782813, 'height': 0.27467814}
tomato paste:   31.25%  {'additional_properties': {}, 'left': 0.4923783, 'top': 0.35007596, 'width': 0.13668466, 'height': 0.28304994}
tomato paste:   31.05%  {'additional_properties': {}, 'left': 0.36416405, 'top': 0.37494493, 'width': 0.14024884, 'height': 0.26880276}
Task - ပုံပေါ်မှာ bounding boxes ဆွဲပါ
-
Pip package Pillow ကိုပုံများပေါ်မှာဆွဲရန်အသုံးပြုနိုင်သည်။ အောက်ပါ command ဖြင့် install လုပ်ပါ:
pip3 install pillowVirtual IoT device ကိုအသုံးပြုနေပါက activated virtual environment အတွင်းမှ run လုပ်ပါ။
-
app.pyဖိုင်၏ အပေါ်ဆုံးတွင် အောက်ပါ import statement ကိုထည့်ပါ:from PIL import Image, ImageDraw, ImageColorပုံကို edit လုပ်ရန်လိုအပ်သော code ကို import လုပ်ပါသည်။
-
app.pyဖိုင်၏ အဆုံးတွင် အောက်ပါ code ကိုထည့်ပါ:with Image.open('image.jpg') as im: draw = ImageDraw.Draw(im) for prediction in predictions: scale_left = prediction.bounding_box.left scale_top = prediction.bounding_box.top scale_right = prediction.bounding_box.left + prediction.bounding_box.width scale_bottom = prediction.bounding_box.top + prediction.bounding_box.height left = scale_left * im.width top = scale_top * im.height right = scale_right * im.width bottom = scale_bottom * im.height draw.rectangle([left, top, right, bottom], outline=ImageColor.getrgb('red'), width=2) im.save('image.jpg')ဒီ code က အရင်က save လုပ်ထားသောပုံကို edit လုပ်ရန်ဖွင့်ပါသည်။ ထို့နောက် prediction တွေကို loop လုပ်ပြီး bounding boxes တွေကိုရယူကာ bottom right coordinate ကို bounding box values (0-1) အသုံးပြု၍တွက်ချက်သည်။ ဥပမာအားဖြင့် left value က 0.5 ဖြစ်ပြီး ပုံရဲ့ width က 600 pixels ဖြစ်ပါက 300 (0.5 x 600 = 300) ဖြစ်သည်။
Bounding box တစ်ခုချင်းစီကို အနီရောင်လိုင်းဖြင့်ပုံပေါ်မှာဆွဲသည်။ နောက်ဆုံးတွင် edit လုပ်ထားသောပုံကို original ပုံကို overwrite လုပ်ပြီး save လုပ်သည်။
-
ကင်မရာကို စတော့ရှယ်ယာရှိသော shelf ကိုညွှန်းထားပြီး app ကို run လုပ်ပါ။
image.jpgဖိုင်ကို VS Code explorer မှာတွေ့ရမည်ဖြစ်ပြီး bounding boxes တွေကိုကြည့်နိုင်ပါမည်။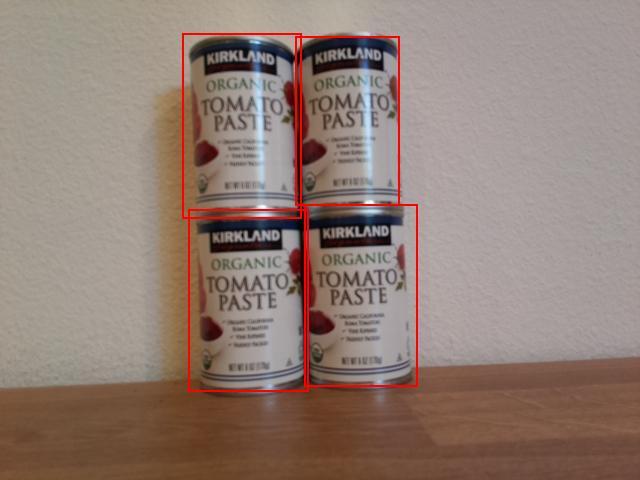
စတော့ရှယ်ယာရေတွက်ခြင်း
အထက်ပါပုံတွင် bounding boxes တွေမှာ အနည်းငယ် overlap ရှိသည်။ overlap ကပိုကြီးလာပါက bounding boxes တွေက object တစ်ခုတည်းကိုပြသနိုင်သည်။ object တွေကိုမှန်ကန်စွာရေတွက်ရန် overlap အများကြီးရှိသော boxes တွေကိုလျစ်လျူရှုရန်လိုအပ်သည်။
Task - overlap ကိုလျစ်လျူရှုပြီး စတော့ရှယ်ယာရေတွက်ပါ
-
Pip package Shapely ကို intersection တွက်ချက်ရန်အသုံးပြုနိုင်သည်။ Raspberry Pi ကိုအသုံးပြုနေပါက library dependency ကိုအရင် install လုပ်ရန်လိုအပ်သည်:
sudo apt install libgeos-dev -
Shapely Pip package ကို install လုပ်ပါ:
pip3 install shapelyVirtual IoT device ကိုအသုံးပြုနေပါက activated virtual environment အတွင်းမှ run လုပ်ပါ။
-
app.pyဖိုင်၏ အပေါ်ဆုံးတွင် အောက်ပါ import statement ကိုထည့်ပါ:from shapely.geometry import PolygonPolygon တွေကိုဖန်တီးပြီး overlap တွက်ချက်ရန်လိုအပ်သော code ကို import လုပ်ပါသည်။
-
Bounding boxes တွေကိုဆွဲရန် code အပေါ်တွင် အောက်ပါ code ကိုထည့်ပါ:
overlap_threshold = 0.20Bounding boxes တွေကို object တစ်ခုတည်းအဖြစ်သတ်မှတ်ရန် overlap ရာခိုင်နှုန်းကိုသတ်မှတ်သည်။ 0.20 က 20% overlap ကိုဖော်ပြသည်။
-
Bounding boxes တွေကို Shapely polygons အဖြစ်ပြောင်းရန်အောက်ပါ function ကိုထည့်ပါ:
def create_polygon(prediction):
    scale_left = prediction.bounding_box.left
    scale_top = prediction.bounding_box.top
    scale_right = prediction.bounding_box.left + prediction.bounding_box.width
    scale_bottom = prediction.bounding_box.top + prediction.bounding_box.height

    return Polygon([(scale_left, scale_top), (scale_right, scale_top), (scale_right, scale_bottom), (scale_left, scale_bottom)])
Prediction တစ်ခု၏ bounding box ကိုအသုံးပြု၍ polygon တစ်ခုကိုဖန်တီးသည်။
-
Overlapping objects တွေကိုဖယ်ရှားရန် logic က bounding boxes တွေကို pair-wise နှိုင်းယှဉ်သည်။ Prediction 1 ကို 2, 3, 4, စသည်ဖြင့်နှိုင်းယှဉ်ပြီး၊ 2 ကို 3, 4, စသည်ဖြင့်နှိုင်းယှဉ်သည်။ အောက်ပါ code ကဒီလုပ်ငန်းကိုလုပ်ဆောင်သည်:
to_delete = []

for i in range(0, len(predictions)):
    polygon_1 = create_polygon(predictions[i])

    for j in range(i+1, len(predictions)):
        polygon_2 = create_polygon(predictions[j])
        overlap = polygon_1.intersection(polygon_2).area

        smallest_area = min(polygon_1.area, polygon_2.area)

        if overlap > (overlap_threshold * smallest_area):
            to_delete.append(predictions[i])
            break

for d in to_delete:
    predictions.remove(d)

print(f'Counted {len(predictions)} stock items')
Overlap ကို Shapely
Polygon.intersectionmethod ကိုအသုံးပြု၍ တွက်ချက်သည်။ ဒီ method က overlap ရှိသော polygon ကို return ပြန်သည်။ ထို့နောက် area ကို polygon မှတွက်ချက်သည်။ Overlap threshold က absolute value မဟုတ်ဘဲ bounding box ရဲ့ percentage အနေနှင့်သတ်မှတ်ရမည်။ အငယ်ဆုံး bounding box ကိုရှာပြီး overlap threshold ကိုအသုံးပြု၍ overlap area ကိုတွက်ချက်သည်။ Overlap က threshold ကိုကျော်လွန်ပါက prediction ကိုဖယ်ရှားရန်သတ်မှတ်သည်။Prediction တစ်ခုကိုဖယ်ရှားရန်သတ်မှတ်ပြီးနောက် loop ကို break လုပ်ကာနောက်တစ်ခုကိုစစ်ဆေးသည်။ List ကို iterate လုပ်နေစဉ် item တွေကို delete လုပ်လို့မရသဖြင့် overlap threshold ကျော်လွန်သော bounding boxes တွေကို
to_deletelist ထဲထည့်ပြီးနောက်ဆုံးတွင် delete လုပ်သည်။နောက်ဆုံးတွင် stock count ကို console မှာ print လုပ်သည်။ ဒီ data ကို IoT service သို့ပို့ပြီး stock အနည်းဆုံးရှိသောအခြေအနေကို alert ပေးနိုင်သည်။ ဒီ code အားလုံးက bounding boxes တွေကိုဆွဲမည့် code အပေါ်မှာရှိသည်။ ထို့ကြောင့် overlap မရှိသော stock predictions တွေကို generated images တွေမှာတွေ့ရမည်။
💁 ဒီ code က overlap ကိုဖယ်ရှားရန်အလွန်ရိုးရှင်းသောနည်းလမ်းဖြစ်ပြီး overlap ရှိသော pair တွေထဲကပထမတစ်ခုကိုဖယ်ရှားသည်။ Production code အတွက် logic ပိုမိုထည့်သွင်းရန်လိုအပ်ပြီး၊ object များစွာအကြား overlap တွေကိုစဉ်းစားခြင်း၊ သို့မဟုတ် bounding box တစ်ခုကတစ်ခုကိုအပြည့်အဝပါဝင်ခြင်းစသည်တို့ကိုစဉ်းစားရန်လိုအပ်သည်။
-
ကင်မရာကို စတော့ရှယ်ယာရှိသော shelf ကိုညွှန်းထားပြီး app ကို run လုပ်ပါ။ Output မှာ overlap threshold ကိုကျော်လွန်သော bounding boxes မပါဝင်သော object အရေအတွက်ကိုပြသမည်။
overlap_thresholdvalue ကိုပြောင်းလဲပြီး prediction တွေကိုလျစ်လျူရှုခြင်းကိုကြည့်ပါ။
💁 ဒီ code ကို code-count/pi သို့မဟုတ် code-count/virtual-iot-device folder တွင်တွေ့နိုင်သည်။
😀 သင့် stock counter program အောင်မြင်ခဲ့ပါသည်!
ဝက်ဘ်ဆိုက်မှတ်ချက်:
ဤစာရွက်စာတမ်းကို AI ဘာသာပြန်ဝန်ဆောင်မှု Co-op Translator ကို အသုံးပြု၍ ဘာသာပြန်ထားပါသည်။ ကျွန်ုပ်တို့သည် တိကျမှန်ကန်မှုအတွက် ကြိုးစားနေသော်လည်း၊ အလိုအလျောက်ဘာသာပြန်မှုများတွင် အမှားများ သို့မဟုတ် မှားယွင်းမှုများ ပါဝင်နိုင်သည်ကို ကျေးဇူးပြု၍ သတိပြုပါ။ မူရင်းဘာသာစကားဖြင့် ရေးသားထားသော စာရွက်စာတမ်းကို အာဏာတည်သော ရင်းမြစ်အဖြစ် သတ်မှတ်ရန် လိုအပ်ပါသည်။ အရေးကြီးသော အချက်အလက်များအတွက် လူ့ဘာသာပြန်ပညာရှင်များမှ ပြန်ဆိုမှုကို အကြံပြုပါသည်။ ဤဘာသာပြန်မှုကို အသုံးပြုခြင်းမှ ဖြစ်ပေါ်လာသော နားလည်မှုမှားများ သို့မဟုတ် အဓိပ္ပာယ်မှားများအတွက် ကျွန်ုပ်တို့သည် တာဝန်မယူပါ။