16 KiB
Postscript: Model Debugging in Machine Learning using Responsible AI dashboard components
Pre-lecture quiz
Introduction
Machine learning plays a significant role in our daily lives. AI is increasingly integrated into critical systems that impact individuals and society, such as healthcare, finance, education, and employment. For example, models are used in decision-making tasks like diagnosing health conditions or detecting fraud. However, as AI advances and adoption accelerates, societal expectations and regulations are evolving in response. We often encounter situations where AI systems fail to meet expectations, reveal new challenges, or face regulatory scrutiny. Therefore, it is crucial to analyze these models to ensure they deliver fair, reliable, inclusive, transparent, and accountable outcomes for everyone.
In this curriculum, we will explore practical tools to assess whether a model has responsible AI issues. Traditional machine learning debugging techniques often rely on quantitative metrics like aggregated accuracy or average error loss. But what happens when the data used to build these models lacks representation of certain demographics, such as race, gender, political views, or religion—or disproportionately represents them? What if the model's output favors one demographic over another? This can lead to over- or under-representation of sensitive feature groups, resulting in fairness, inclusiveness, or reliability issues. Additionally, machine learning models are often considered "black boxes," making it difficult to understand and explain their predictions. These are challenges faced by data scientists and AI developers when they lack adequate tools to debug and assess a model's fairness or trustworthiness.
In this lesson, you will learn how to debug your models using:
- Error Analysis: Identify areas in your data distribution where the model has high error rates.
- Model Overview: Compare performance metrics across different data cohorts to uncover disparities.
- Data Analysis: Investigate over- or under-representation in your data that may skew the model to favor certain demographics.
- Feature Importance: Understand which features drive your model’s predictions at both global and local levels.
Prerequisite
Before starting, review Responsible AI tools for developers.

Error Analysis
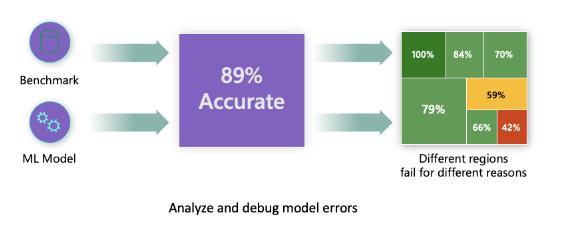
Traditional model performance metrics, such as accuracy, are often based on correct versus incorrect predictions. For instance, a model with 89% accuracy and an error loss of 0.001 might seem to perform well. However, errors are not always evenly distributed across the dataset. While the model may achieve 89% accuracy overall, certain regions of the data might have a failure rate of 42%. These failure patterns can lead to fairness or reliability issues, especially if they affect important data demographics. Understanding where the model performs well or poorly is essential. High error rates in specific data regions may highlight critical demographic groups.
The Error Analysis component in the RAI dashboard visualizes how model errors are distributed across various cohorts using a tree diagram. This helps identify features or areas with high error rates in your dataset. By pinpointing where most inaccuracies occur, you can investigate the root causes. You can also create data cohorts to analyze why the model performs well in one cohort but poorly in another.
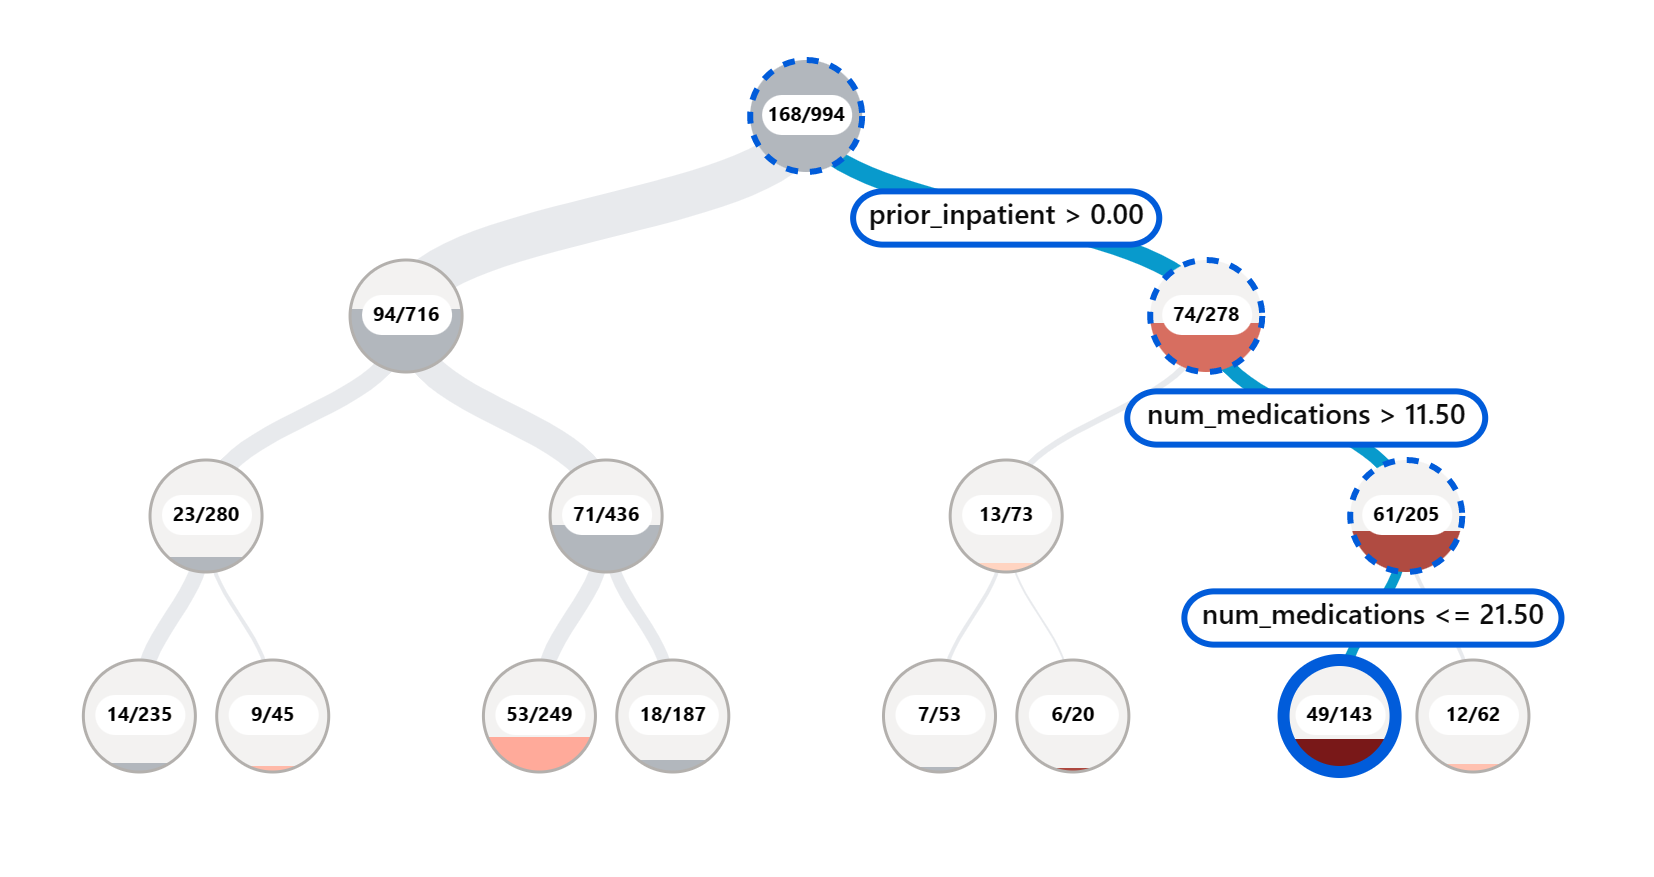
The tree map uses visual indicators to quickly locate problem areas. For example, darker red nodes indicate higher error rates.
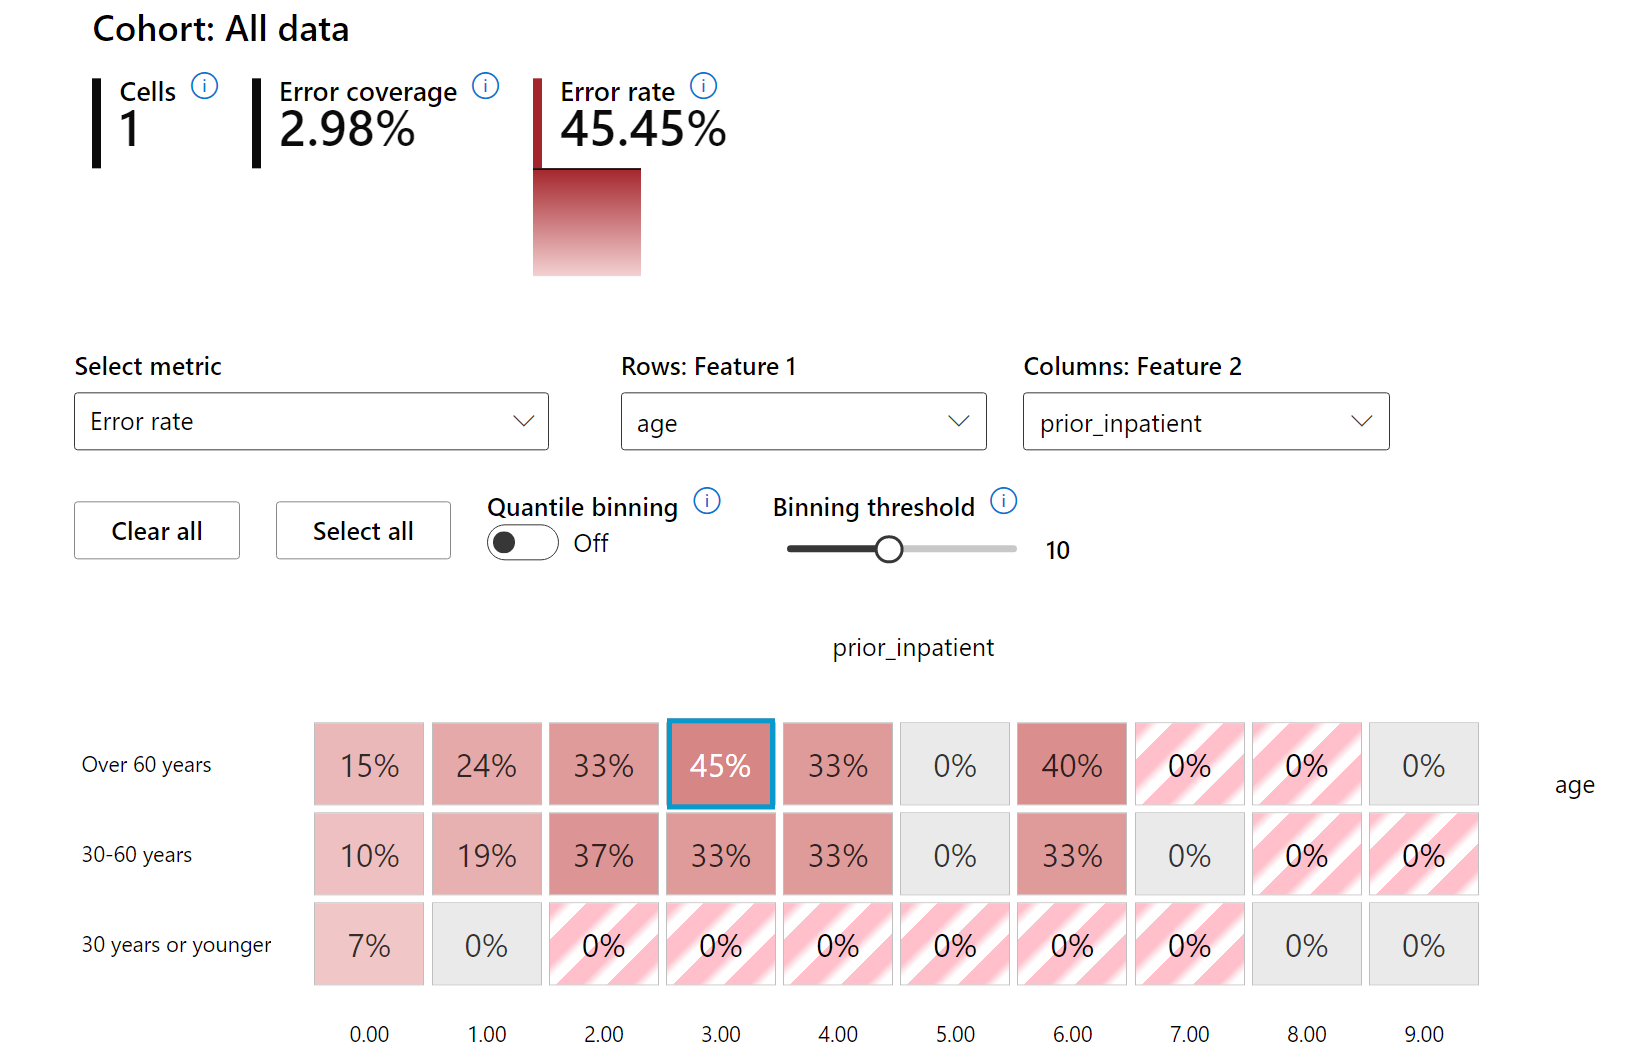
A heat map is another visualization tool that allows users to investigate error rates using one or two features, helping identify contributors to model errors across the dataset or specific cohorts.
Use error analysis to:
- Gain a deeper understanding of how model errors are distributed across the dataset and feature dimensions.
- Break down aggregate performance metrics to automatically discover erroneous cohorts and inform targeted mitigation strategies.
Model Overview
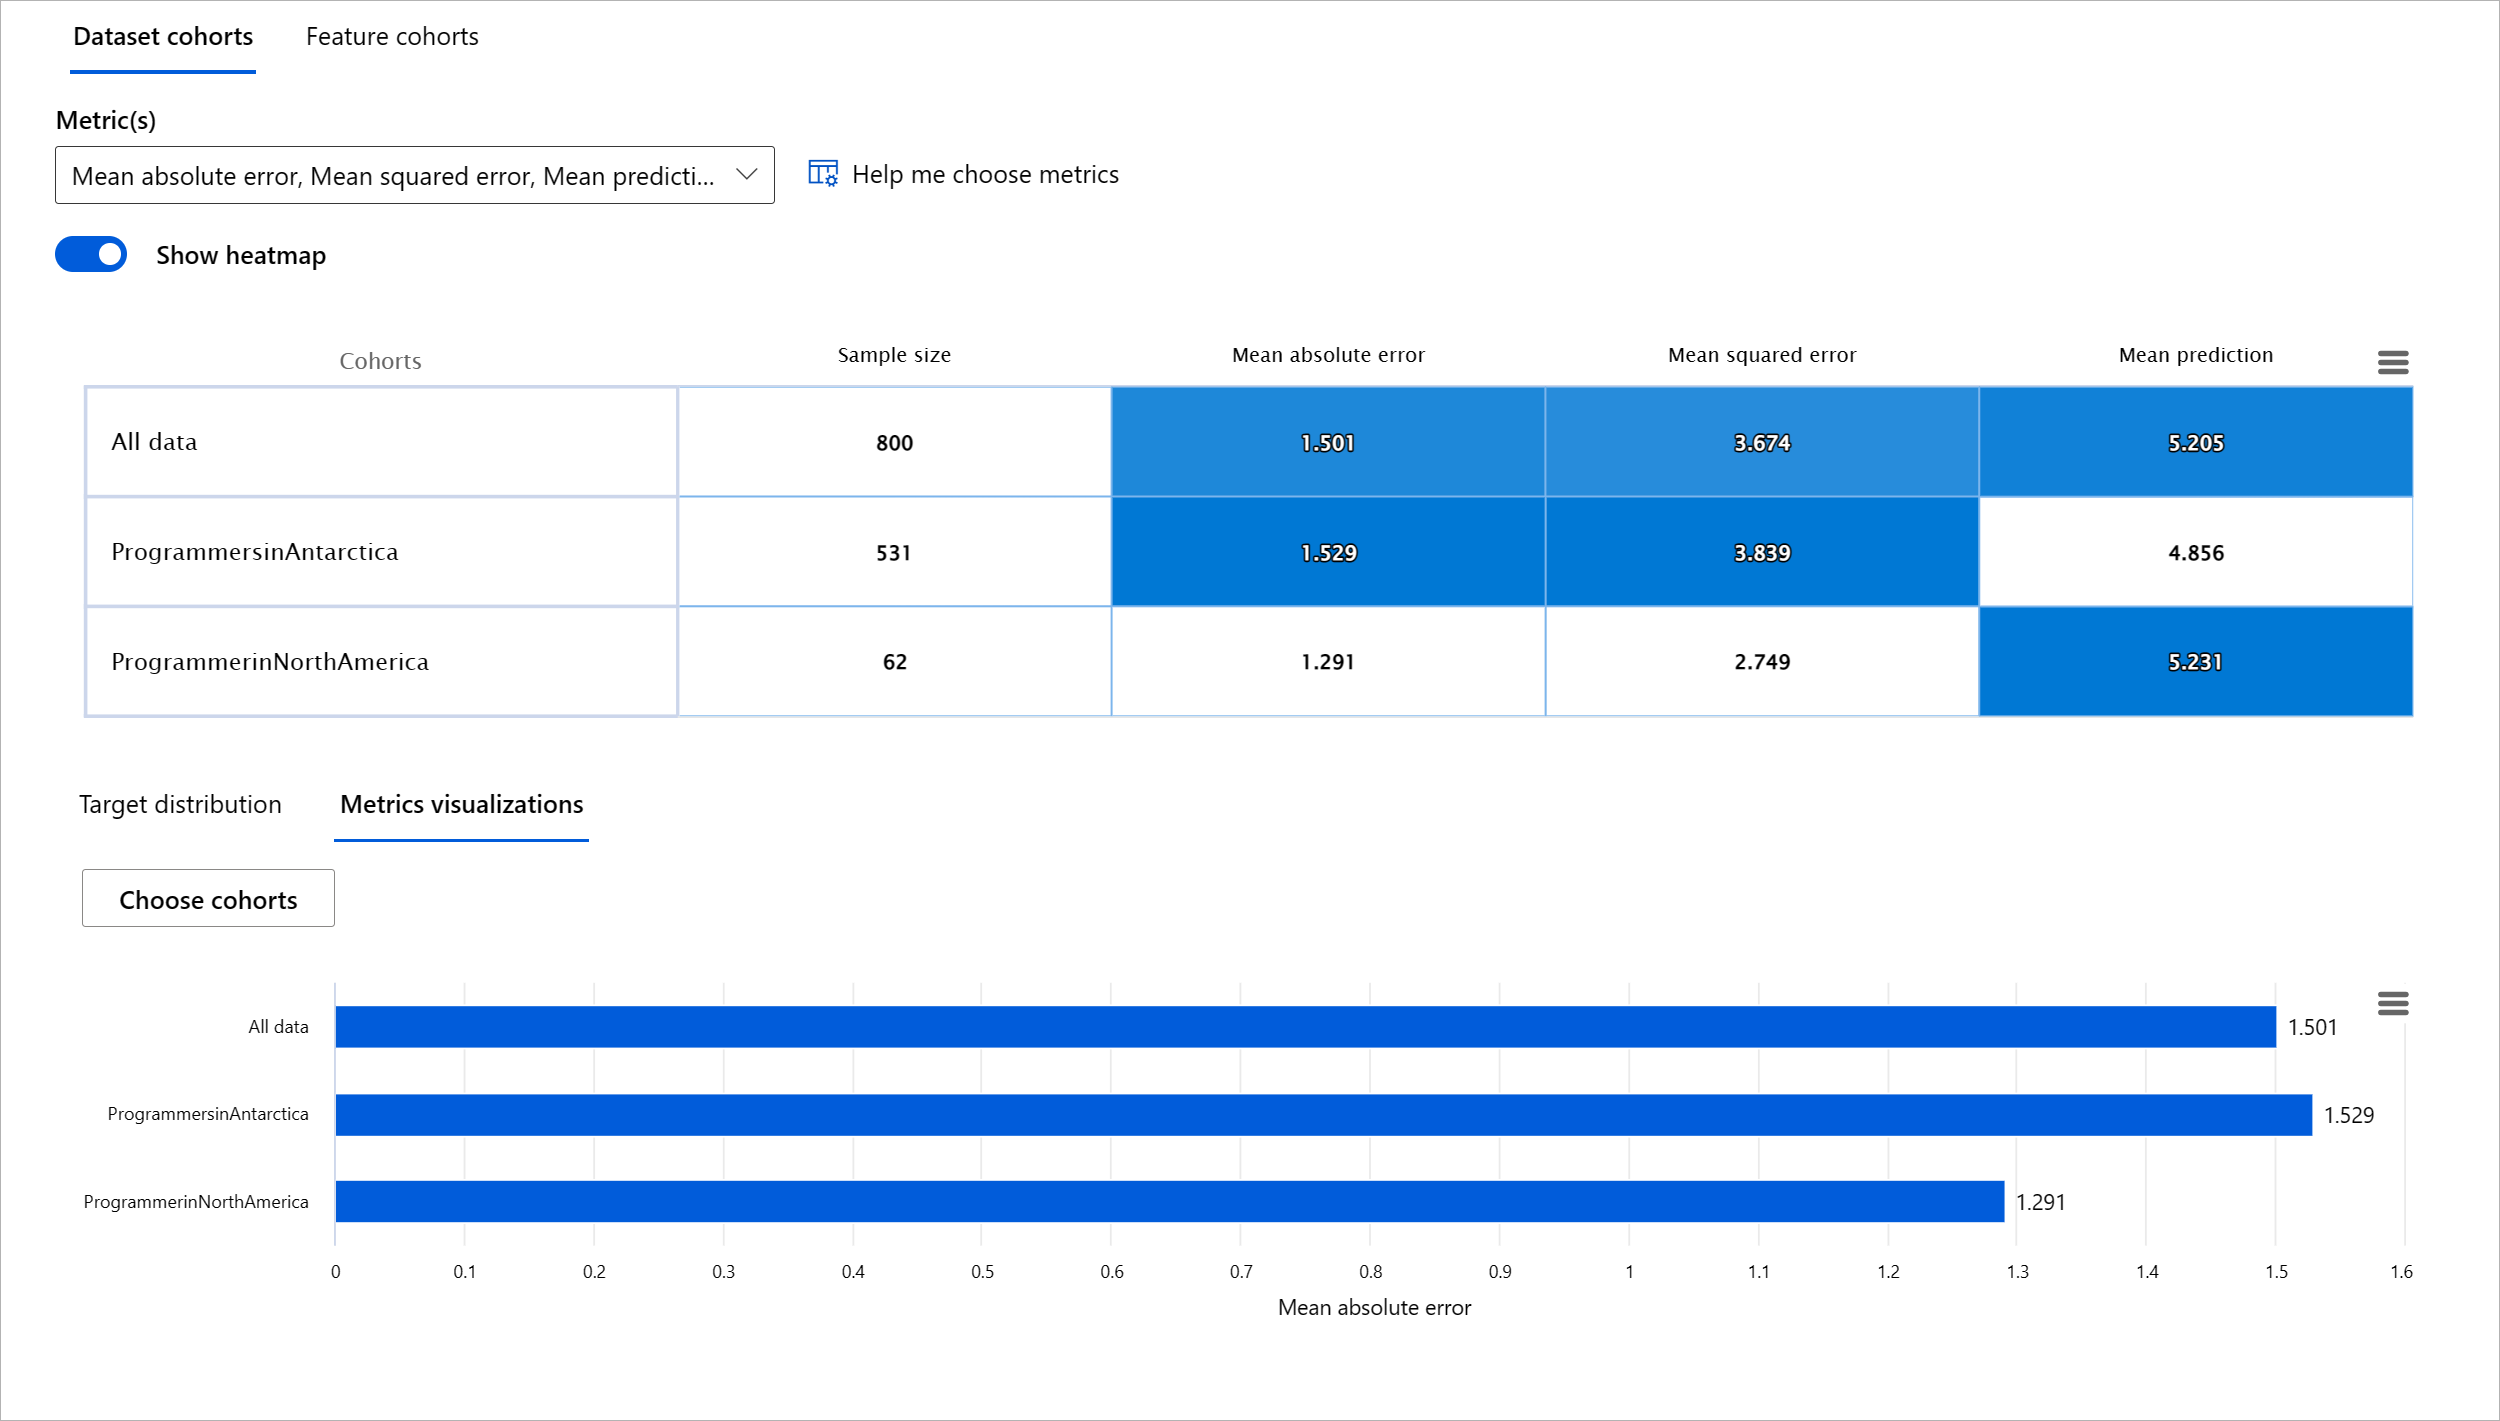
Evaluating a machine learning model’s performance requires a comprehensive understanding of its behavior. This involves reviewing multiple metrics, such as error rate, accuracy, recall, precision, or MAE (Mean Absolute Error), to identify disparities. A single metric may appear strong, but weaknesses can be revealed in others. Comparing metrics across the entire dataset or specific cohorts can highlight areas where the model performs well or poorly. This is particularly important for sensitive features (e.g., race, gender, or age) to uncover potential fairness issues. For example, higher error rates in cohorts with sensitive features may indicate bias.
The Model Overview component in the RAI dashboard enables users to analyze performance metrics for data representation in cohorts and compare the model’s behavior across different groups.
The feature-based analysis functionality allows users to focus on specific data subgroups within a feature to identify anomalies at a granular level. For instance, the dashboard can automatically generate cohorts for a user-selected feature (e.g., "time_in_hospital < 3" or "time_in_hospital >= 7"), enabling users to isolate features and determine their influence on erroneous outcomes.
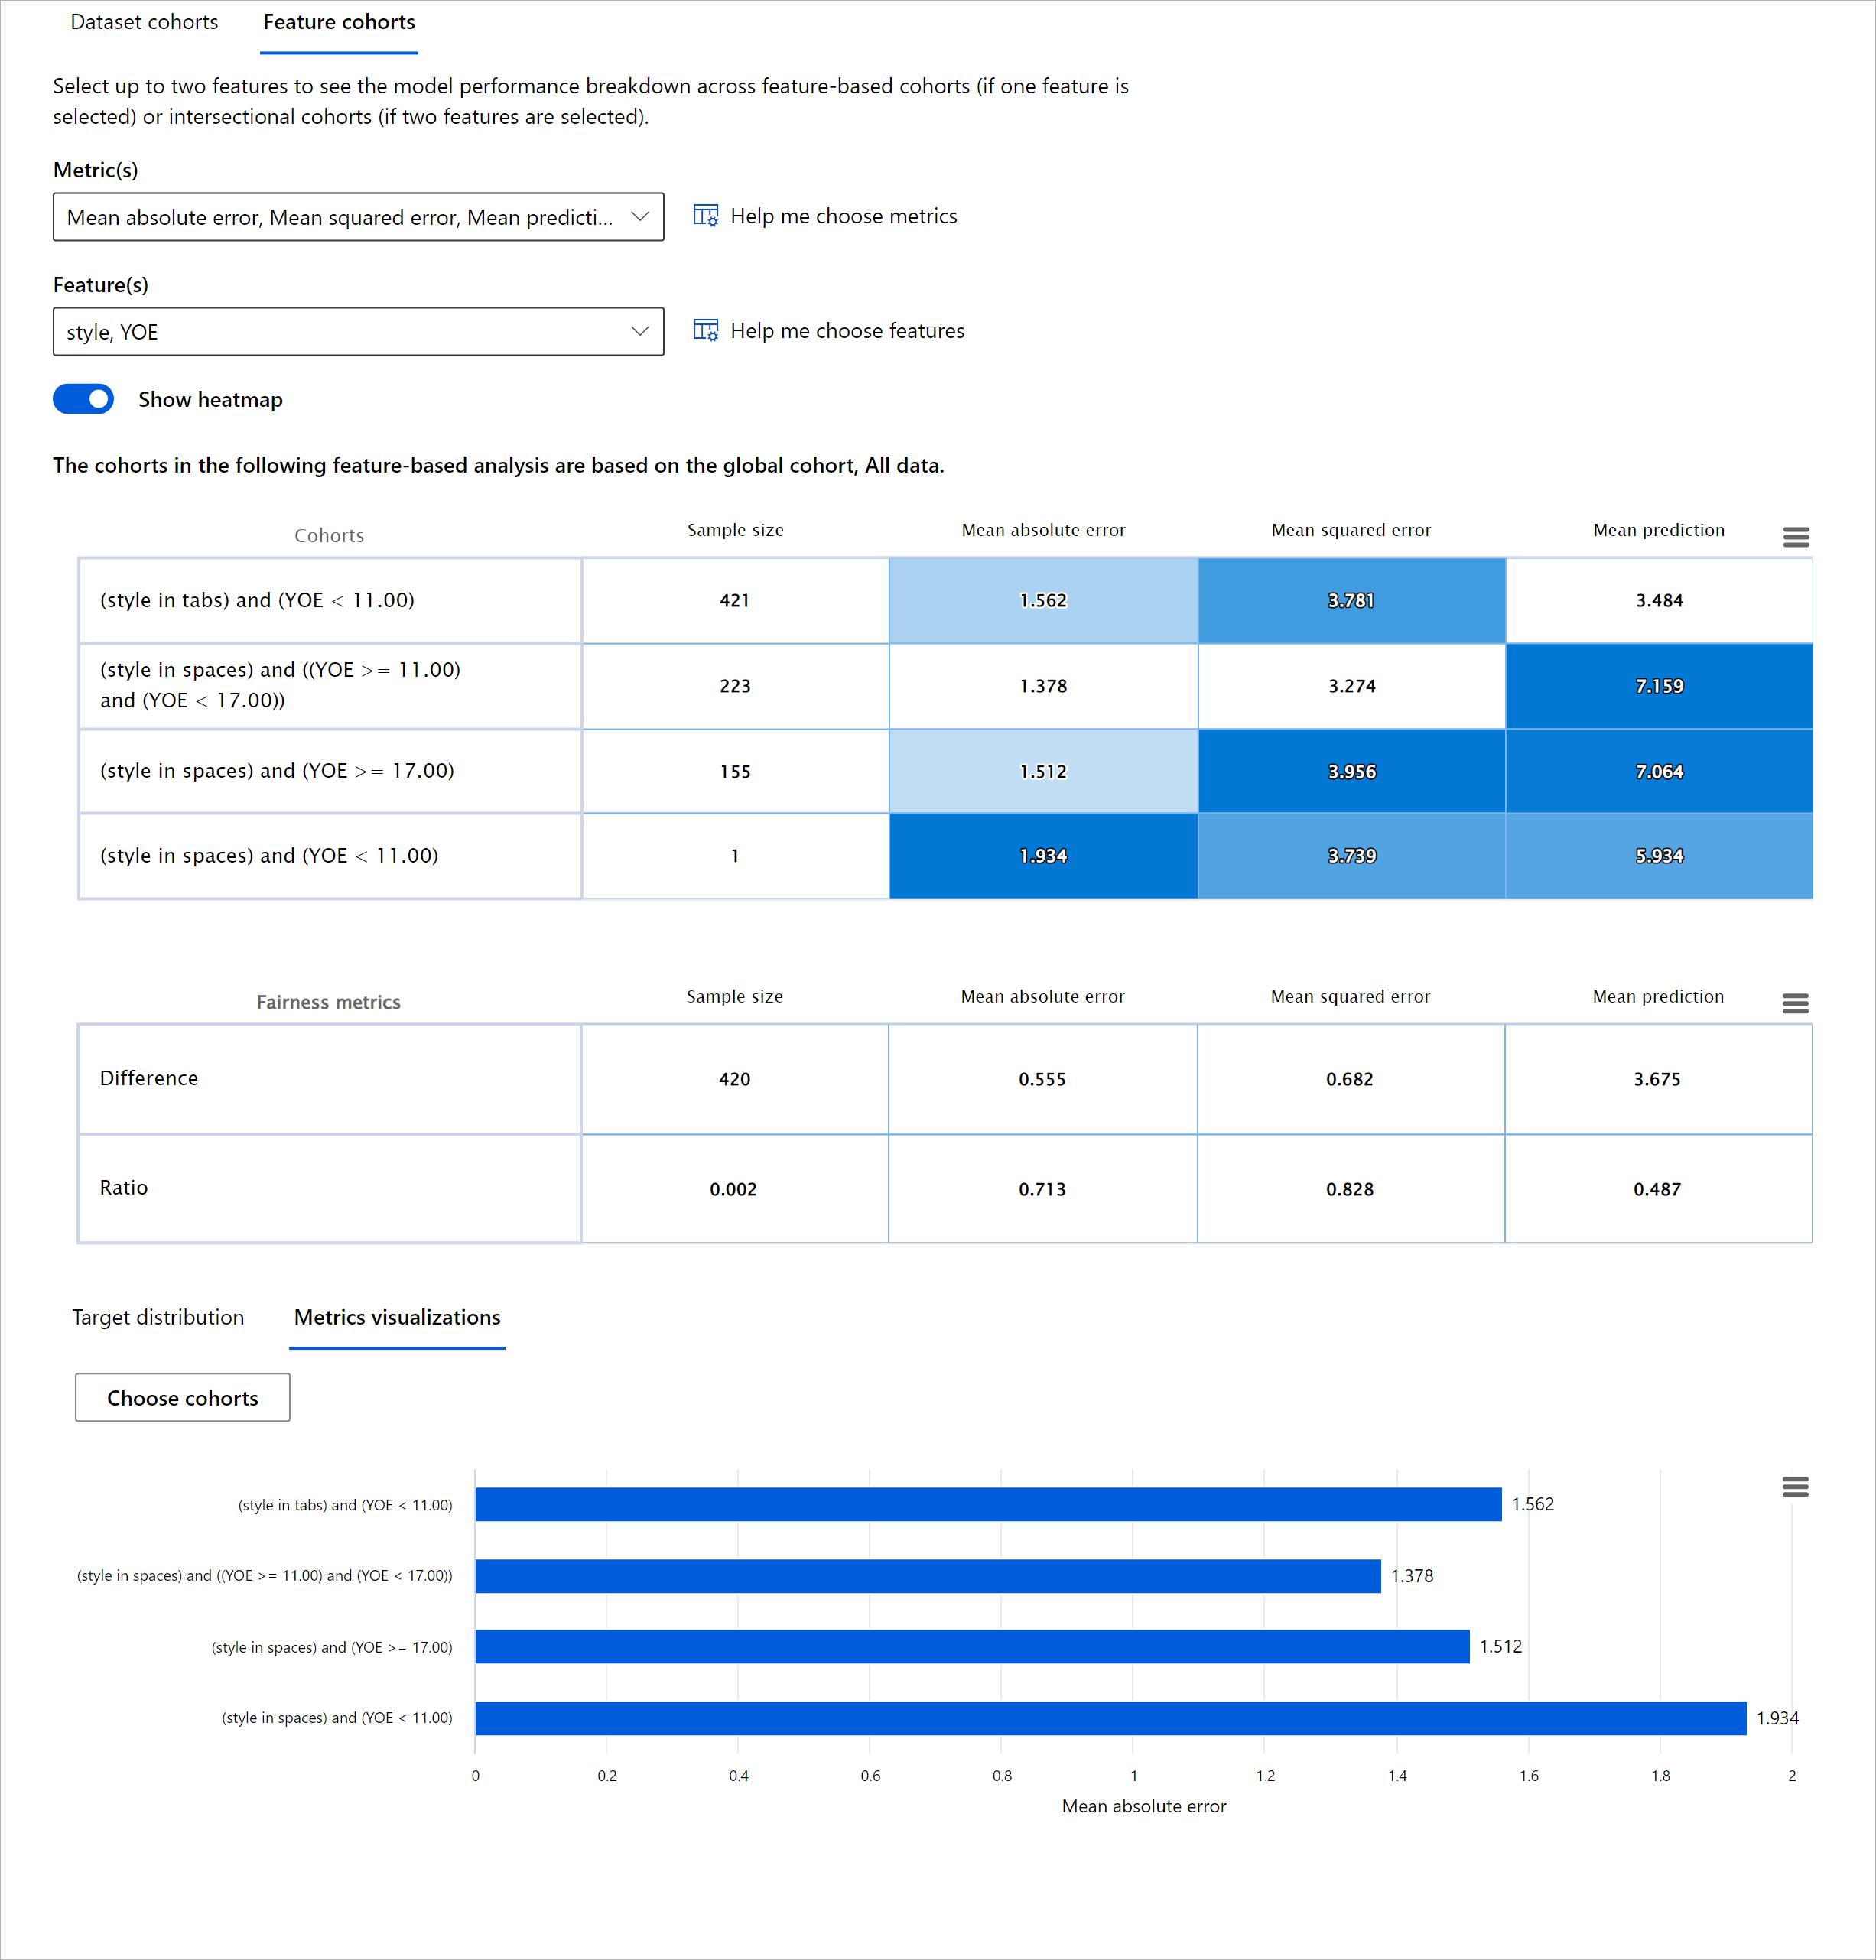
The Model Overview component supports two types of disparity metrics:
Disparity in model performance: These metrics calculate differences in performance values across data subgroups. Examples include:
- Disparity in accuracy rate
- Disparity in error rate
- Disparity in precision
- Disparity in recall
- Disparity in mean absolute error (MAE)
Disparity in selection rate: This metric measures differences in favorable predictions among subgroups. For example, disparity in loan approval rates. Selection rate refers to the fraction of data points classified as 1 (in binary classification) or the distribution of prediction values (in regression).
Data Analysis
"If you torture the data long enough, it will confess to anything" - Ronald Coase
This statement may sound extreme, but data can indeed be manipulated to support any conclusion—sometimes unintentionally. As humans, we all have biases, and it can be difficult to recognize when bias is introduced into data. Ensuring fairness in AI and machine learning remains a complex challenge.
Traditional model performance metrics often overlook data bias. High accuracy scores do not necessarily reflect underlying biases in the dataset. For example, if a dataset contains 27% women and 73% men in executive positions, a job advertising AI model trained on this data may disproportionately target men for senior-level positions. This imbalance skews the model’s predictions, revealing a fairness issue and gender bias.
The Data Analysis component in the RAI dashboard helps identify over- and under-representation in datasets. It allows users to diagnose errors and fairness issues caused by data imbalances or lack of representation. Users can visualize datasets based on predicted and actual outcomes, error groups, and specific features. Discovering underrepresented data groups can also reveal that the model is not learning effectively, leading to inaccuracies. Data bias not only raises fairness concerns but also indicates that the model lacks inclusiveness and reliability.
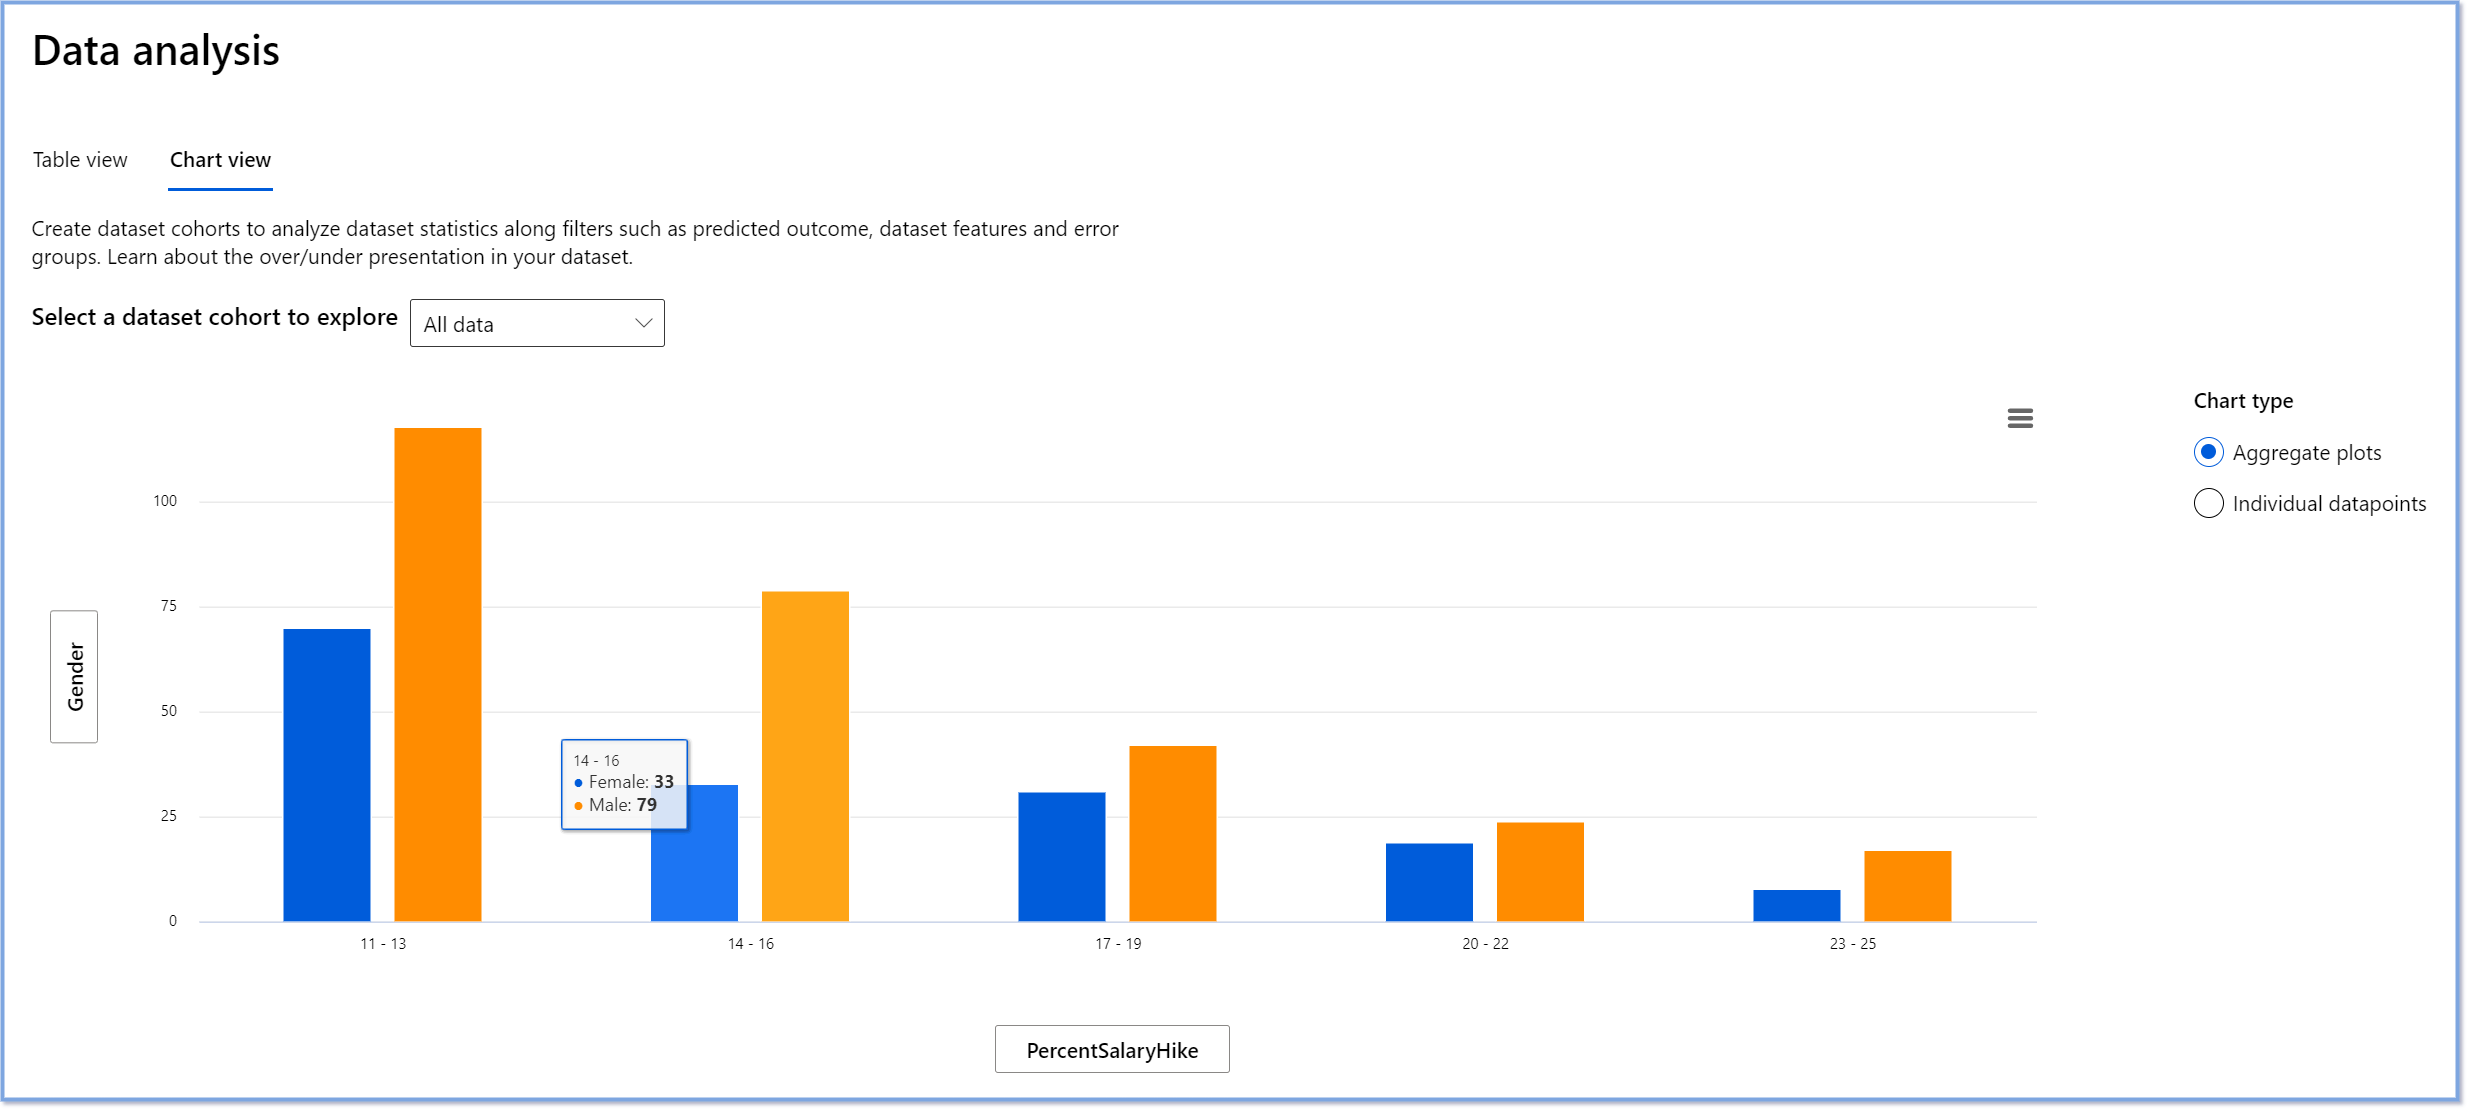
Use data analysis to:
- Explore dataset statistics by applying filters to slice data into different dimensions (cohorts).
- Understand dataset distribution across cohorts and feature groups.
- Determine whether fairness, error analysis, and causality findings (from other dashboard components) are influenced by dataset distribution.
- Identify areas where additional data collection is needed to address representation issues, label noise, feature noise, label bias, and similar factors.
Model Interpretability
Machine learning models are often "black boxes," making it challenging to understand which features drive predictions. Transparency is essential to explain why a model makes certain predictions. For example, if an AI system predicts that a diabetic patient is at risk of readmission within 30 days, it should provide supporting data for its prediction. Transparency helps clinicians and hospitals make informed decisions and ensures accountability with health regulations. When machine learning models impact people’s lives, understanding and explaining their behavior is crucial. Model interpretability addresses questions such as:
- Model debugging: Why did my model make this mistake? How can I improve it?
- Human-AI collaboration: How can I understand and trust the model’s decisions?
- Regulatory compliance: Does my model meet legal requirements?
The Feature Importance component in the RAI dashboard helps debug and understand how a model makes predictions. It is a valuable tool for machine learning professionals and decision-makers to explain features influencing a model’s behavior for regulatory compliance. Users can explore global and local explanations to validate which features drive predictions. Global explanations identify top features affecting overall predictions, while local explanations focus on features influencing individual cases. Local explanations are particularly useful for debugging or auditing specific cases to understand why a model made accurate or inaccurate predictions.
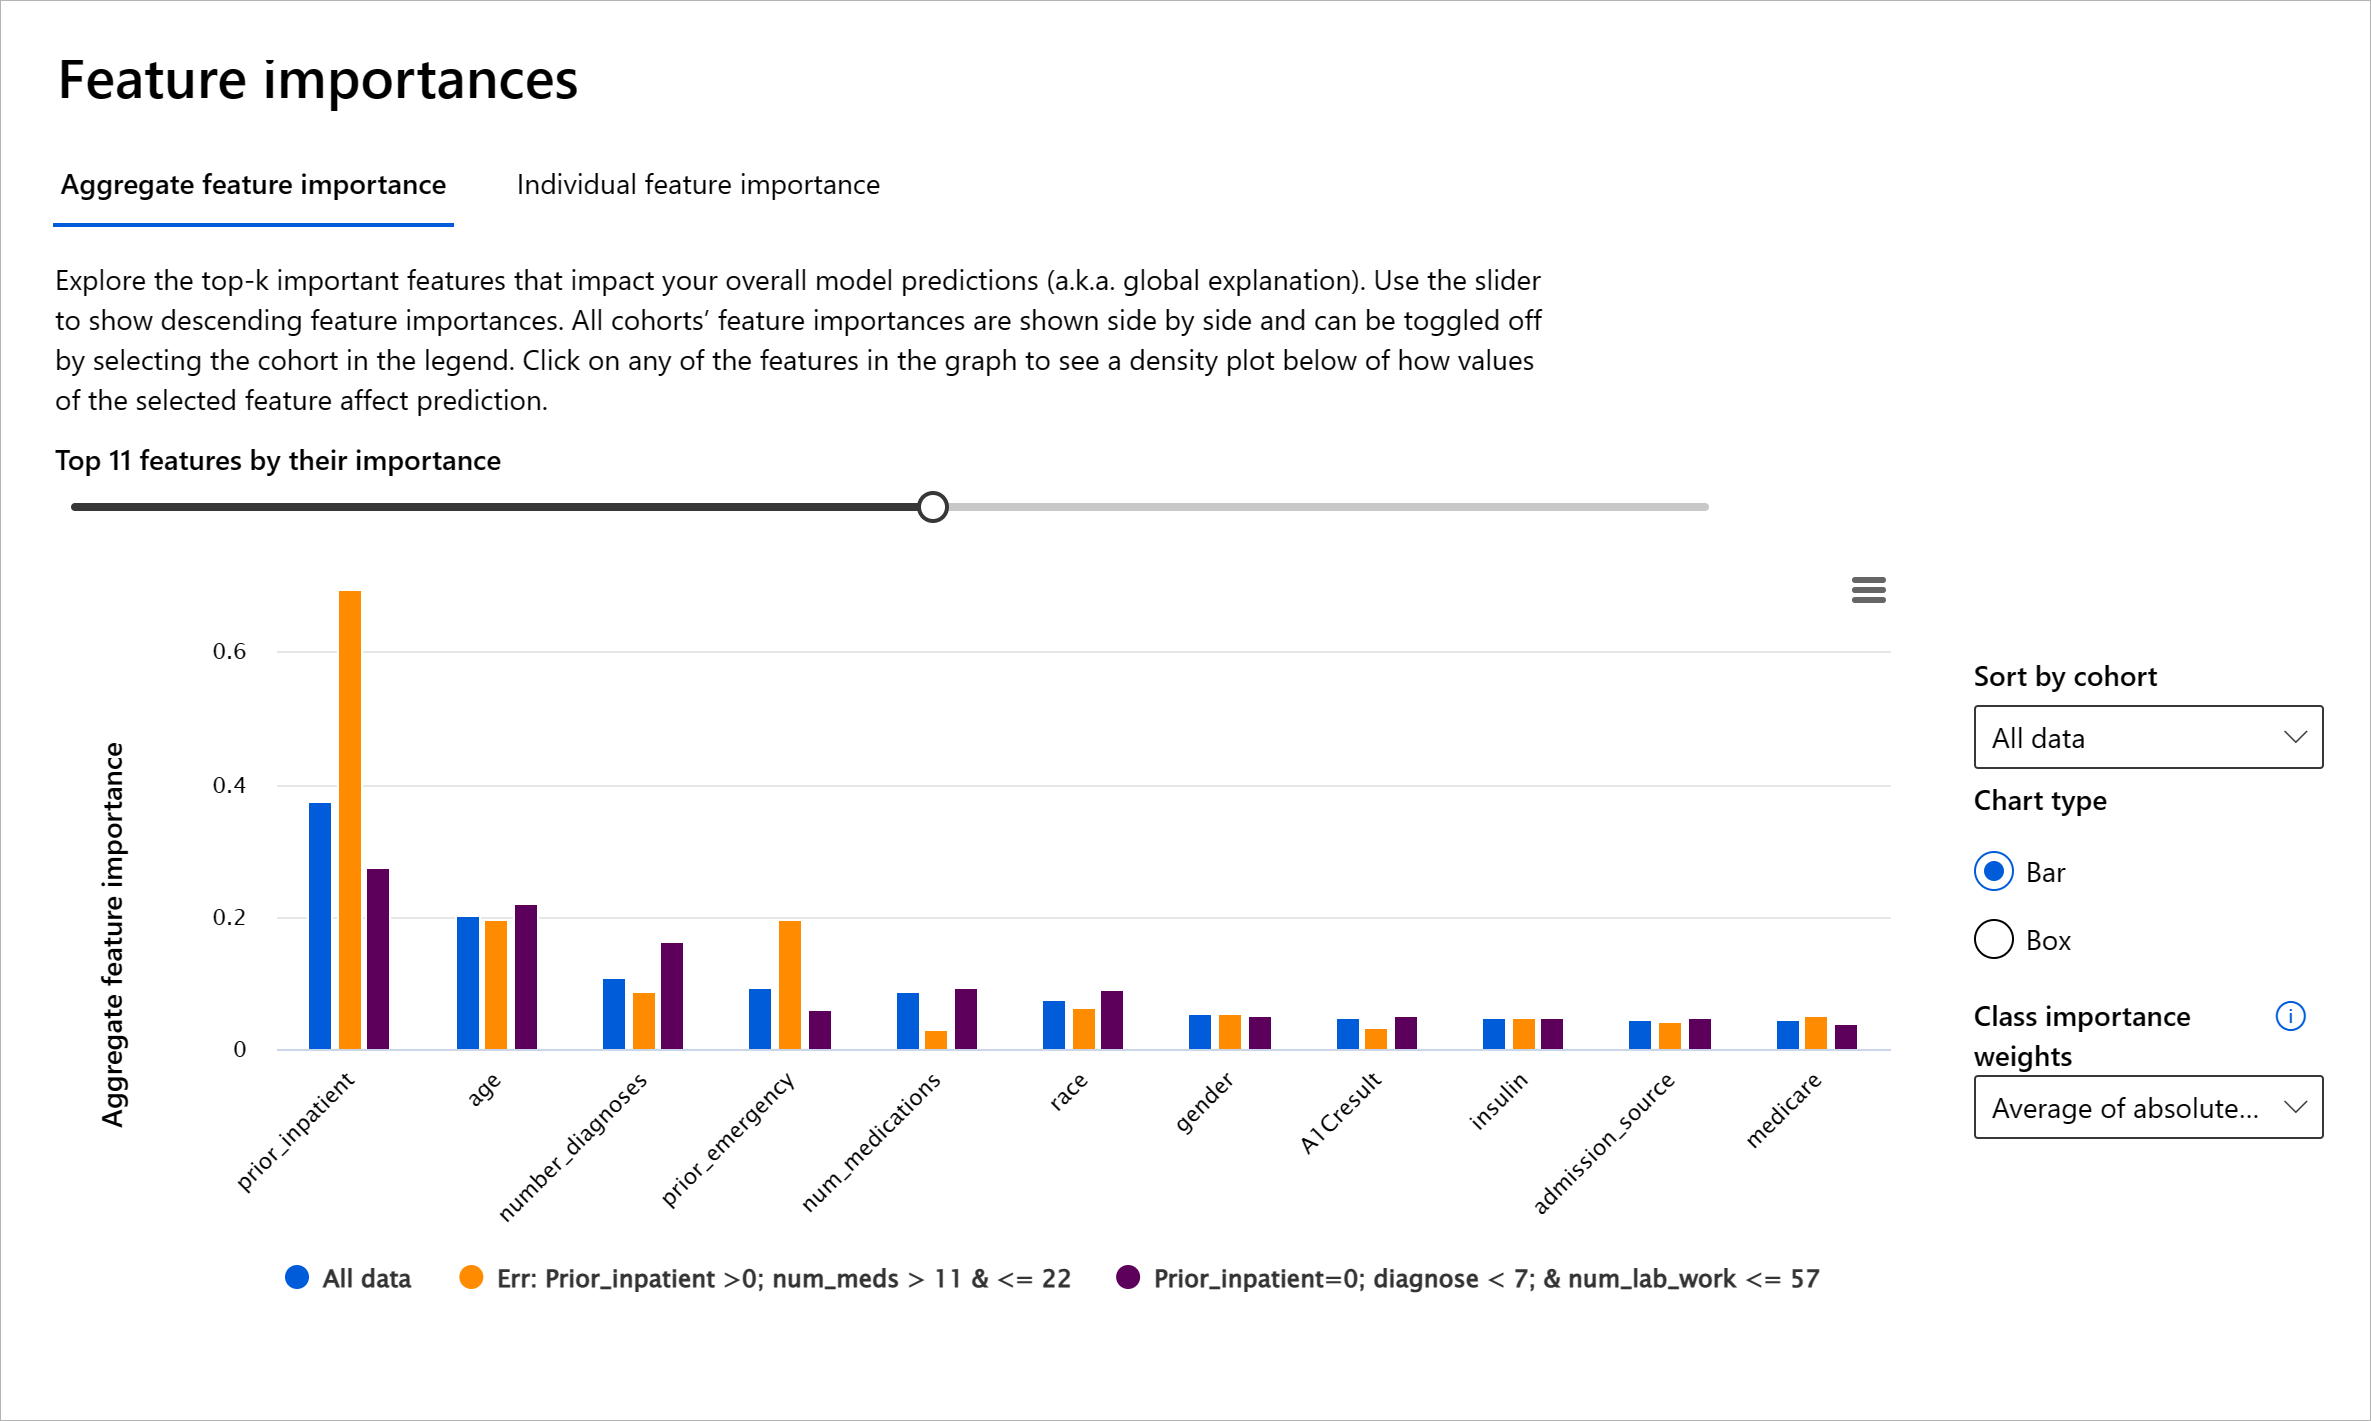
- Global explanations: For example, what features influence the overall behavior of a diabetes hospital readmission model?
- Local explanations: For example, why was a diabetic patient over 60 years old with prior hospitalizations predicted to be readmitted or not readmitted within 30 days?
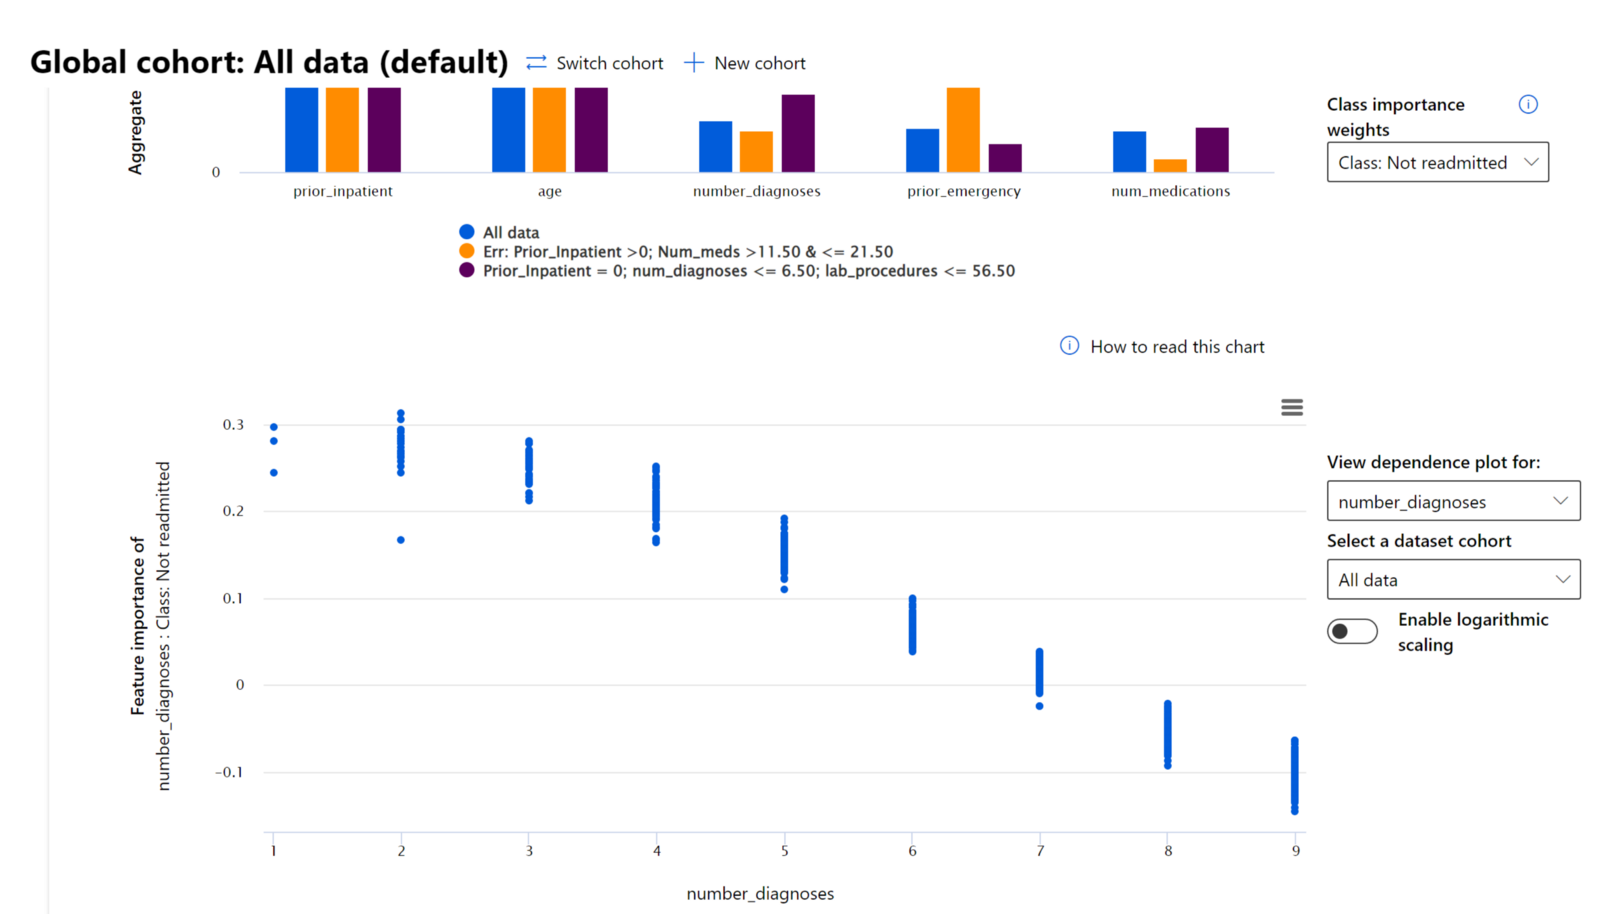
In debugging a model’s performance across cohorts, Feature Importance reveals the impact of features on predictions. It helps identify anomalies by comparing feature influence on erroneous predictions. The component can show which feature values positively or negatively influenced outcomes. For instance, if a model made an inaccurate prediction, the component allows users to drill down and pinpoint the features responsible. This level of detail aids debugging, provides transparency, and ensures accountability in audits. Additionally, it can help identify fairness issues. For example, if sensitive features like ethnicity or gender significantly influence predictions, this may indicate bias.
Use interpretability to:
- Assess the trustworthiness of AI predictions by understanding key features driving outcomes.
- Debug models by identifying whether they rely on meaningful features or false correlations.
- Detect potential fairness issues by examining whether predictions are based on sensitive features or features correlated with them.
- Build user trust by generating local explanations to illustrate outcomes.
- Conduct regulatory audits to validate models and monitor their impact on humans.
Conclusion
The RAI dashboard components are practical tools for building machine learning models that are less harmful and more trustworthy. They help prevent threats to human rights, discrimination, exclusion from opportunities, and risks of physical or psychological harm. Additionally, they foster trust in model decisions by generating local explanations to illustrate outcomes. Potential harms can be categorized as:
- Allocation: Favoring one gender or ethnicity over another.
- Quality of service: Training data for a specific scenario while neglecting real-world complexity, leading to poor service performance.
- Stereotyping: Associating a group with predefined attributes.
- Denigration: Unfairly criticizing or labeling something or someone.
- Over- or under-representation. This concept refers to situations where certain groups are not visible in specific professions, and any service or function that continues to promote this imbalance contributes to harm.
Azure RAI Dashboard
Azure RAI Dashboard is built on open-source tools developed by leading academic institutions and organizations, including Microsoft. These tools are essential for data scientists and AI developers to better understand model behavior, identify and address undesirable issues in AI models.
-
Learn how to use the various components by reviewing the RAI dashboard documentation.
-
Explore some RAI dashboard sample notebooks to debug more responsible AI scenarios in Azure Machine Learning.
🚀 Challenge
To prevent statistical or data biases from being introduced in the first place, we should:
- Ensure diversity in backgrounds and perspectives among the people working on systems.
- Invest in datasets that represent the diversity of our society.
- Develop better methods for detecting and correcting bias when it occurs.
Consider real-world scenarios where unfairness is evident in model development and application. What additional factors should we take into account?
Post-lecture quiz
Review & Self Study
In this lesson, you’ve learned about practical tools for incorporating responsible AI into machine learning.
Watch this workshop to explore the topics further:
- Responsible AI Dashboard: A comprehensive solution for operationalizing RAI in practice by Besmira Nushi and Mehrnoosh Sameki

🎥 Click the image above to watch the video: Responsible AI Dashboard: A comprehensive solution for operationalizing RAI in practice by Besmira Nushi and Mehrnoosh Sameki
Refer to the following resources to learn more about responsible AI and how to create more trustworthy models:
-
Microsoft’s RAI dashboard tools for debugging ML models: Responsible AI tools resources
-
Explore the Responsible AI toolkit: GitHub
-
Microsoft’s RAI resource center: Responsible AI Resources – Microsoft AI
-
Microsoft’s FATE research group: FATE: Fairness, Accountability, Transparency, and Ethics in AI - Microsoft Research
Assignment
Disclaimer:
This document has been translated using the AI translation service Co-op Translator. While we aim for accuracy, please note that automated translations may include errors or inaccuracies. The original document in its native language should be regarded as the definitive source. For critical information, professional human translation is advised. We are not responsible for any misunderstandings or misinterpretations resulting from the use of this translation.