8.2 KiB
Count stock from your IoT device - Wio Terminal
A combination of predictions and their bounding boxes can be used to count stock in an image.
Count stock
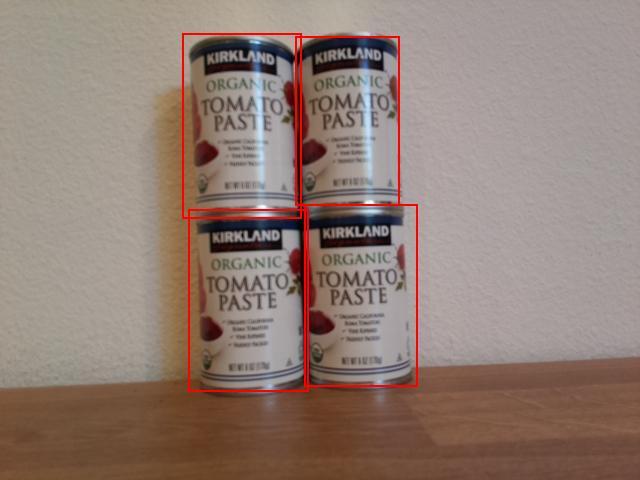
In the image shown above, the bounding boxes slightly overlap. If this overlap were much larger, the bounding boxes might represent the same object. To count the objects accurately, you need to ignore boxes with significant overlap.
Task - count stock ignoring overlap
-
Open your
stock-counterproject if it is not already open. -
Above the
processPredictionsfunction, add the following code:const float overlap_threshold = 0.20f;This defines the percentage overlap allowed before the bounding boxes are considered to represent the same object. 0.20 corresponds to a 20% overlap.
-
Below this, and above the
processPredictionsfunction, add the following code to calculate the overlap between two rectangles:struct Point { float x, y; }; struct Rect { Point topLeft, bottomRight; }; float area(Rect rect) { return abs(rect.bottomRight.x - rect.topLeft.x) * abs(rect.bottomRight.y - rect.topLeft.y); } float overlappingArea(Rect rect1, Rect rect2) { float left = max(rect1.topLeft.x, rect2.topLeft.x); float right = min(rect1.bottomRight.x, rect2.bottomRight.x); float top = max(rect1.topLeft.y, rect2.topLeft.y); float bottom = min(rect1.bottomRight.y, rect2.bottomRight.y); if ( right > left && bottom > top ) { return (right-left)*(bottom-top); } return 0.0f; }This code defines a
Pointstruct to store points on the image, and aRectstruct to define a rectangle using a top-left and bottom-right coordinate. It then defines anareafunction that calculates the area of a rectangle from a top-left and bottom-right coordinate.Next, it defines an
overlappingAreafunction that calculates the overlapping area of two rectangles. If they don't overlap, it returns 0. -
Below the
overlappingAreafunction, declare a function to convert a bounding box to aRect:Rect rectFromBoundingBox(JsonVariant prediction) { JsonObject bounding_box = prediction["boundingBox"].as<JsonObject>(); float left = bounding_box["left"].as<float>(); float top = bounding_box["top"].as<float>(); float width = bounding_box["width"].as<float>(); float height = bounding_box["height"].as<float>(); Point topLeft = {left, top}; Point bottomRight = {left + width, top + height}; return {topLeft, bottomRight}; }This function takes a prediction from the object detector, extracts the bounding box, and uses the values from the bounding box to define a rectangle. The right side is calculated as the left plus the width. The bottom is calculated as the top plus the height.
-
The predictions need to be compared to each other, and if two predictions have an overlap greater than the threshold, one of them needs to be removed. The overlap threshold is a percentage, so it needs to be multiplied by the size of the smallest bounding box to ensure the overlap exceeds the given percentage of the bounding box, not the percentage of the entire image. Start by deleting the content of the
processPredictionsfunction. -
Add the following to the empty
processPredictionsfunction:std::vector<JsonVariant> passed_predictions; for (int i = 0; i < predictions.size(); ++i) { Rect prediction_1_rect = rectFromBoundingBox(predictions[i]); float prediction_1_area = area(prediction_1_rect); bool passed = true; for (int j = i + 1; j < predictions.size(); ++j) { Rect prediction_2_rect = rectFromBoundingBox(predictions[j]); float prediction_2_area = area(prediction_2_rect); float overlap = overlappingArea(prediction_1_rect, prediction_2_rect); float smallest_area = min(prediction_1_area, prediction_2_area); if (overlap > (overlap_threshold * smallest_area)) { passed = false; break; } } if (passed) { passed_predictions.push_back(predictions[i]); } }This code declares a vector to store the predictions that don't overlap. It then loops through all the predictions, creating a
Rectfrom the bounding box.Next, this code loops through the remaining predictions, starting with the one after the current prediction. This prevents predictions from being compared more than once—once predictions 1 and 2 have been compared, there's no need to compare 2 with 1, only with 3, 4, etc.
For each pair of predictions, the overlapping area is calculated. This is then compared to the area of the smallest bounding box—if the overlap exceeds the threshold percentage of the smallest bounding box, the prediction is marked as not passed. If, after comparing all overlaps, the prediction passes the checks, it is added to the
passed_predictionscollection.💁 This is a very basic way to handle overlaps, simply removing the first one in an overlapping pair. For production code, you would want to add more logic here, such as considering overlaps between multiple objects or checking if one bounding box is entirely contained within another.
-
After this, add the following code to send details of the passed predictions to the serial monitor:
for(JsonVariant prediction : passed_predictions)
{
    String boundingBox = prediction["boundingBox"].as<String>();
    String tag = prediction["tagName"].as<String>();
    float probability = prediction["probability"].as<float>();

    char buff[32];
    sprintf(buff, "%s:\t%.2f%%\t%s", tag.c_str(), probability * 100.0, boundingBox.c_str());
    Serial.println(buff);
}
This code loops through the passed predictions and prints their details to the serial monitor.
-
Below this, add code to print the number of counted items to the serial monitor:
Serial.print("Counted ");
Serial.print(passed_predictions.size());
Serial.println(" stock items.");
This could then be sent to an IoT service to alert you if stock levels are low.
-
Upload and run your code. Point the camera at objects on a shelf and press the C button. Try adjusting the
overlap_thresholdvalue to see predictions being ignored.Connecting to WiFi.. Connected! Image captured Image read to buffer with length 17416 tomato paste: 35.84% {"left":0.395631,"top":0.215897,"width":0.180768,"height":0.359364} tomato paste: 35.87% {"left":0.378554,"top":0.583012,"width":0.14824,"height":0.359382} tomato paste: 34.11% {"left":0.699024,"top":0.592617,"width":0.124411,"height":0.350456} tomato paste: 35.16% {"left":0.513006,"top":0.647853,"width":0.187472,"height":0.325817} Counted 4 stock items.
💁 You can find this code in the code-count/wio-terminal folder.
😀 Your stock counter program was a success!
Disclaimer:
This document has been translated using the AI translation service Co-op Translator. While we strive for accuracy, please note that automated translations may contain errors or inaccuracies. The original document in its native language should be regarded as the authoritative source. For critical information, professional human translation is recommended. We are not responsible for any misunderstandings or misinterpretations resulting from the use of this translation.