9.3 KiB
Count stock from your IoT device - Virtual IoT Hardware and Raspberry Pi
You can use a combination of predictions and their bounding boxes to count stock in an image.
Show bounding boxes
As a useful debugging step, you can not only print out the bounding boxes but also draw them on the image that was saved to disk when an image was captured.
Task - Print the bounding boxes
-
Make sure the
stock-counterproject is open in VS Code, and the virtual environment is activated if you are using a virtual IoT device. -
Modify the
printstatement in theforloop to the following to display the bounding boxes in the console:print(f'{prediction.tag_name}:\t{prediction.probability * 100:.2f}%\t{prediction.bounding_box}') -
Run the app with the camera pointing at some stock on a shelf. The bounding boxes will be displayed in the console, showing left, top, width, and height values ranging from 0-1.
pi@raspberrypi:~/stock-counter $ python3 app.py
tomato paste:   33.42%  {'additional_properties': {}, 'left': 0.3455171, 'top': 0.09916268, 'width': 0.14175442, 'height': 0.29405564}
tomato paste:   34.41%  {'additional_properties': {}, 'left': 0.48283678, 'top': 0.10242918, 'width': 0.11782813, 'height': 0.27467814}
tomato paste:   31.25%  {'additional_properties': {}, 'left': 0.4923783, 'top': 0.35007596, 'width': 0.13668466, 'height': 0.28304994}
tomato paste:   31.05%  {'additional_properties': {}, 'left': 0.36416405, 'top': 0.37494493, 'width': 0.14024884, 'height': 0.26880276}
Task - Draw bounding boxes on the image
-
The Pip package Pillow can be used to draw on images. Install it using the following command:
pip3 install pillowIf you are using a virtual IoT device, ensure you run this command inside the activated virtual environment.
-
Add the following import statement at the top of the
app.pyfile:from PIL import Image, ImageDraw, ImageColorThis imports the necessary code to edit the image.
-
Add the following code at the end of the
app.pyfile:with Image.open('image.jpg') as im: draw = ImageDraw.Draw(im) for prediction in predictions: scale_left = prediction.bounding_box.left scale_top = prediction.bounding_box.top scale_right = prediction.bounding_box.left + prediction.bounding_box.width scale_bottom = prediction.bounding_box.top + prediction.bounding_box.height left = scale_left * im.width top = scale_top * im.height right = scale_right * im.width bottom = scale_bottom * im.height draw.rectangle([left, top, right, bottom], outline=ImageColor.getrgb('red'), width=2) im.save('image.jpg')This code opens the previously saved image for editing. It loops through the predictions to get the bounding boxes and calculates the bottom-right coordinate using the bounding box values (0-1). These values are then converted to image coordinates by multiplying them by the respective dimensions of the image. For example, if the left value is 0.5 on an image that is 600 pixels wide, it converts to 300 (0.5 x 600 = 300).
Each bounding box is drawn on the image using a red line. Finally, the edited image is saved, overwriting the original image.
-
Run the app with the camera pointing at some stock on a shelf. You will see the
image.jpgfile in the VS Code explorer, and you can open it to view the bounding boxes.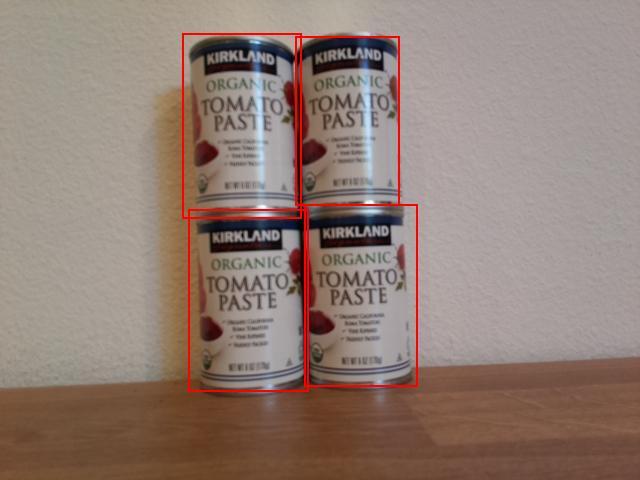
Count stock
In the image above, the bounding boxes have a small overlap. If the overlap were much larger, the bounding boxes might represent the same object. To count the objects accurately, you need to ignore boxes with significant overlap.
Task - Count stock while ignoring overlap
-
The Pip package Shapely can be used to calculate intersections. If you are using a Raspberry Pi, you will need to install a library dependency first:
sudo apt install libgeos-dev -
Install the Shapely Pip package:
pip3 install shapelyIf you are using a virtual IoT device, ensure you run this command inside the activated virtual environment.
-
Add the following import statement at the top of the
app.pyfile:from shapely.geometry import PolygonThis imports the necessary code to create polygons for calculating overlap.
-
Add the following code above the section that draws the bounding boxes:
overlap_threshold = 0.20This defines the percentage overlap allowed before bounding boxes are considered to represent the same object. A value of 0.20 represents a 20% overlap.
-
To calculate overlap using Shapely, the bounding boxes need to be converted into Shapely polygons. Add the following function to achieve this:
def create_polygon(prediction):
    scale_left = prediction.bounding_box.left
    scale_top = prediction.bounding_box.top
    scale_right = prediction.bounding_box.left + prediction.bounding_box.width
    scale_bottom = prediction.bounding_box.top + prediction.bounding_box.height

    return Polygon([(scale_left, scale_top), (scale_right, scale_top), (scale_right, scale_bottom), (scale_left, scale_bottom)])
This function creates a polygon using the bounding box of a prediction.
-
The logic for removing overlapping objects involves comparing all bounding boxes. If any pairs of predictions have bounding boxes that overlap more than the threshold, one of the predictions is deleted. To compare all predictions, you compare prediction 1 with 2, 3, 4, etc., then 2 with 3, 4, etc. The following code performs this comparison:
to_delete = []

for i in range(0, len(predictions)):
    polygon_1 = create_polygon(predictions[i])

    for j in range(i+1, len(predictions)):
        polygon_2 = create_polygon(predictions[j])
        overlap = polygon_1.intersection(polygon_2).area

        smallest_area = min(polygon_1.area, polygon_2.area)

        if overlap > (overlap_threshold * smallest_area):
            to_delete.append(predictions[i])
            break

for d in to_delete:
    predictions.remove(d)

print(f'Counted {len(predictions)} stock items')
The overlap is calculated using Shapely's
Polygon.intersectionmethod, which returns a polygon representing the overlap. The area of this polygon is then calculated. The overlap threshold is not an absolute value but needs to be a percentage of the bounding box. Therefore, the smallest bounding box is identified, and the overlap threshold is used to calculate the maximum allowable overlap area as a percentage of the smallest bounding box. If the overlap exceeds this, the prediction is marked for deletion.Once a prediction is marked for deletion, it doesn't need to be checked again, so the inner loop breaks to check the next prediction. Since you cannot delete items from a list while iterating through it, the bounding boxes that exceed the overlap threshold are added to the
to_deletelist and then deleted at the end.Finally, the stock count is printed to the console. This count could be sent to an IoT service to trigger alerts if stock levels are low. All of this code is executed before the bounding boxes are drawn, so the generated images will show stock predictions without overlaps.
💁 This is a very basic way to handle overlaps, simply removing the first one in an overlapping pair. For production code, you would want to add more sophisticated logic, such as considering overlaps between multiple objects or handling cases where one bounding box is entirely contained within another.
-
Run the app with the camera pointing at some stock on a shelf. The output will show the number of bounding boxes without overlaps exceeding the threshold. Try adjusting the
overlap_thresholdvalue to see how predictions are ignored.
💁 You can find this code in the code-count/pi or code-count/virtual-iot-device folder.
😀 Your stock counter program was a success!
Disclaimer:
This document has been translated using the AI translation service Co-op Translator. While we strive for accuracy, please note that automated translations may contain errors or inaccuracies. The original document in its native language should be regarded as the authoritative source. For critical information, professional human translation is recommended. We are not responsible for any misunderstandings or misinterpretations resulting from the use of this translation.