3.6 KiB
Explore a Planetary Computer Dataset
Instructions
In this lesson, we discussed various domains of data science applications, diving deeper into examples related to research, sustainability, and digital humanities. In this assignment, you'll explore one of these examples in greater detail and apply your knowledge of data visualizations and analysis to extract insights about sustainability data.
The Planetary Computer project offers datasets and APIs that can be accessed with an account—request one if you'd like to try the bonus step of the assignment. The site also includes an Explorer feature that you can use without needing to create an account.
Steps:
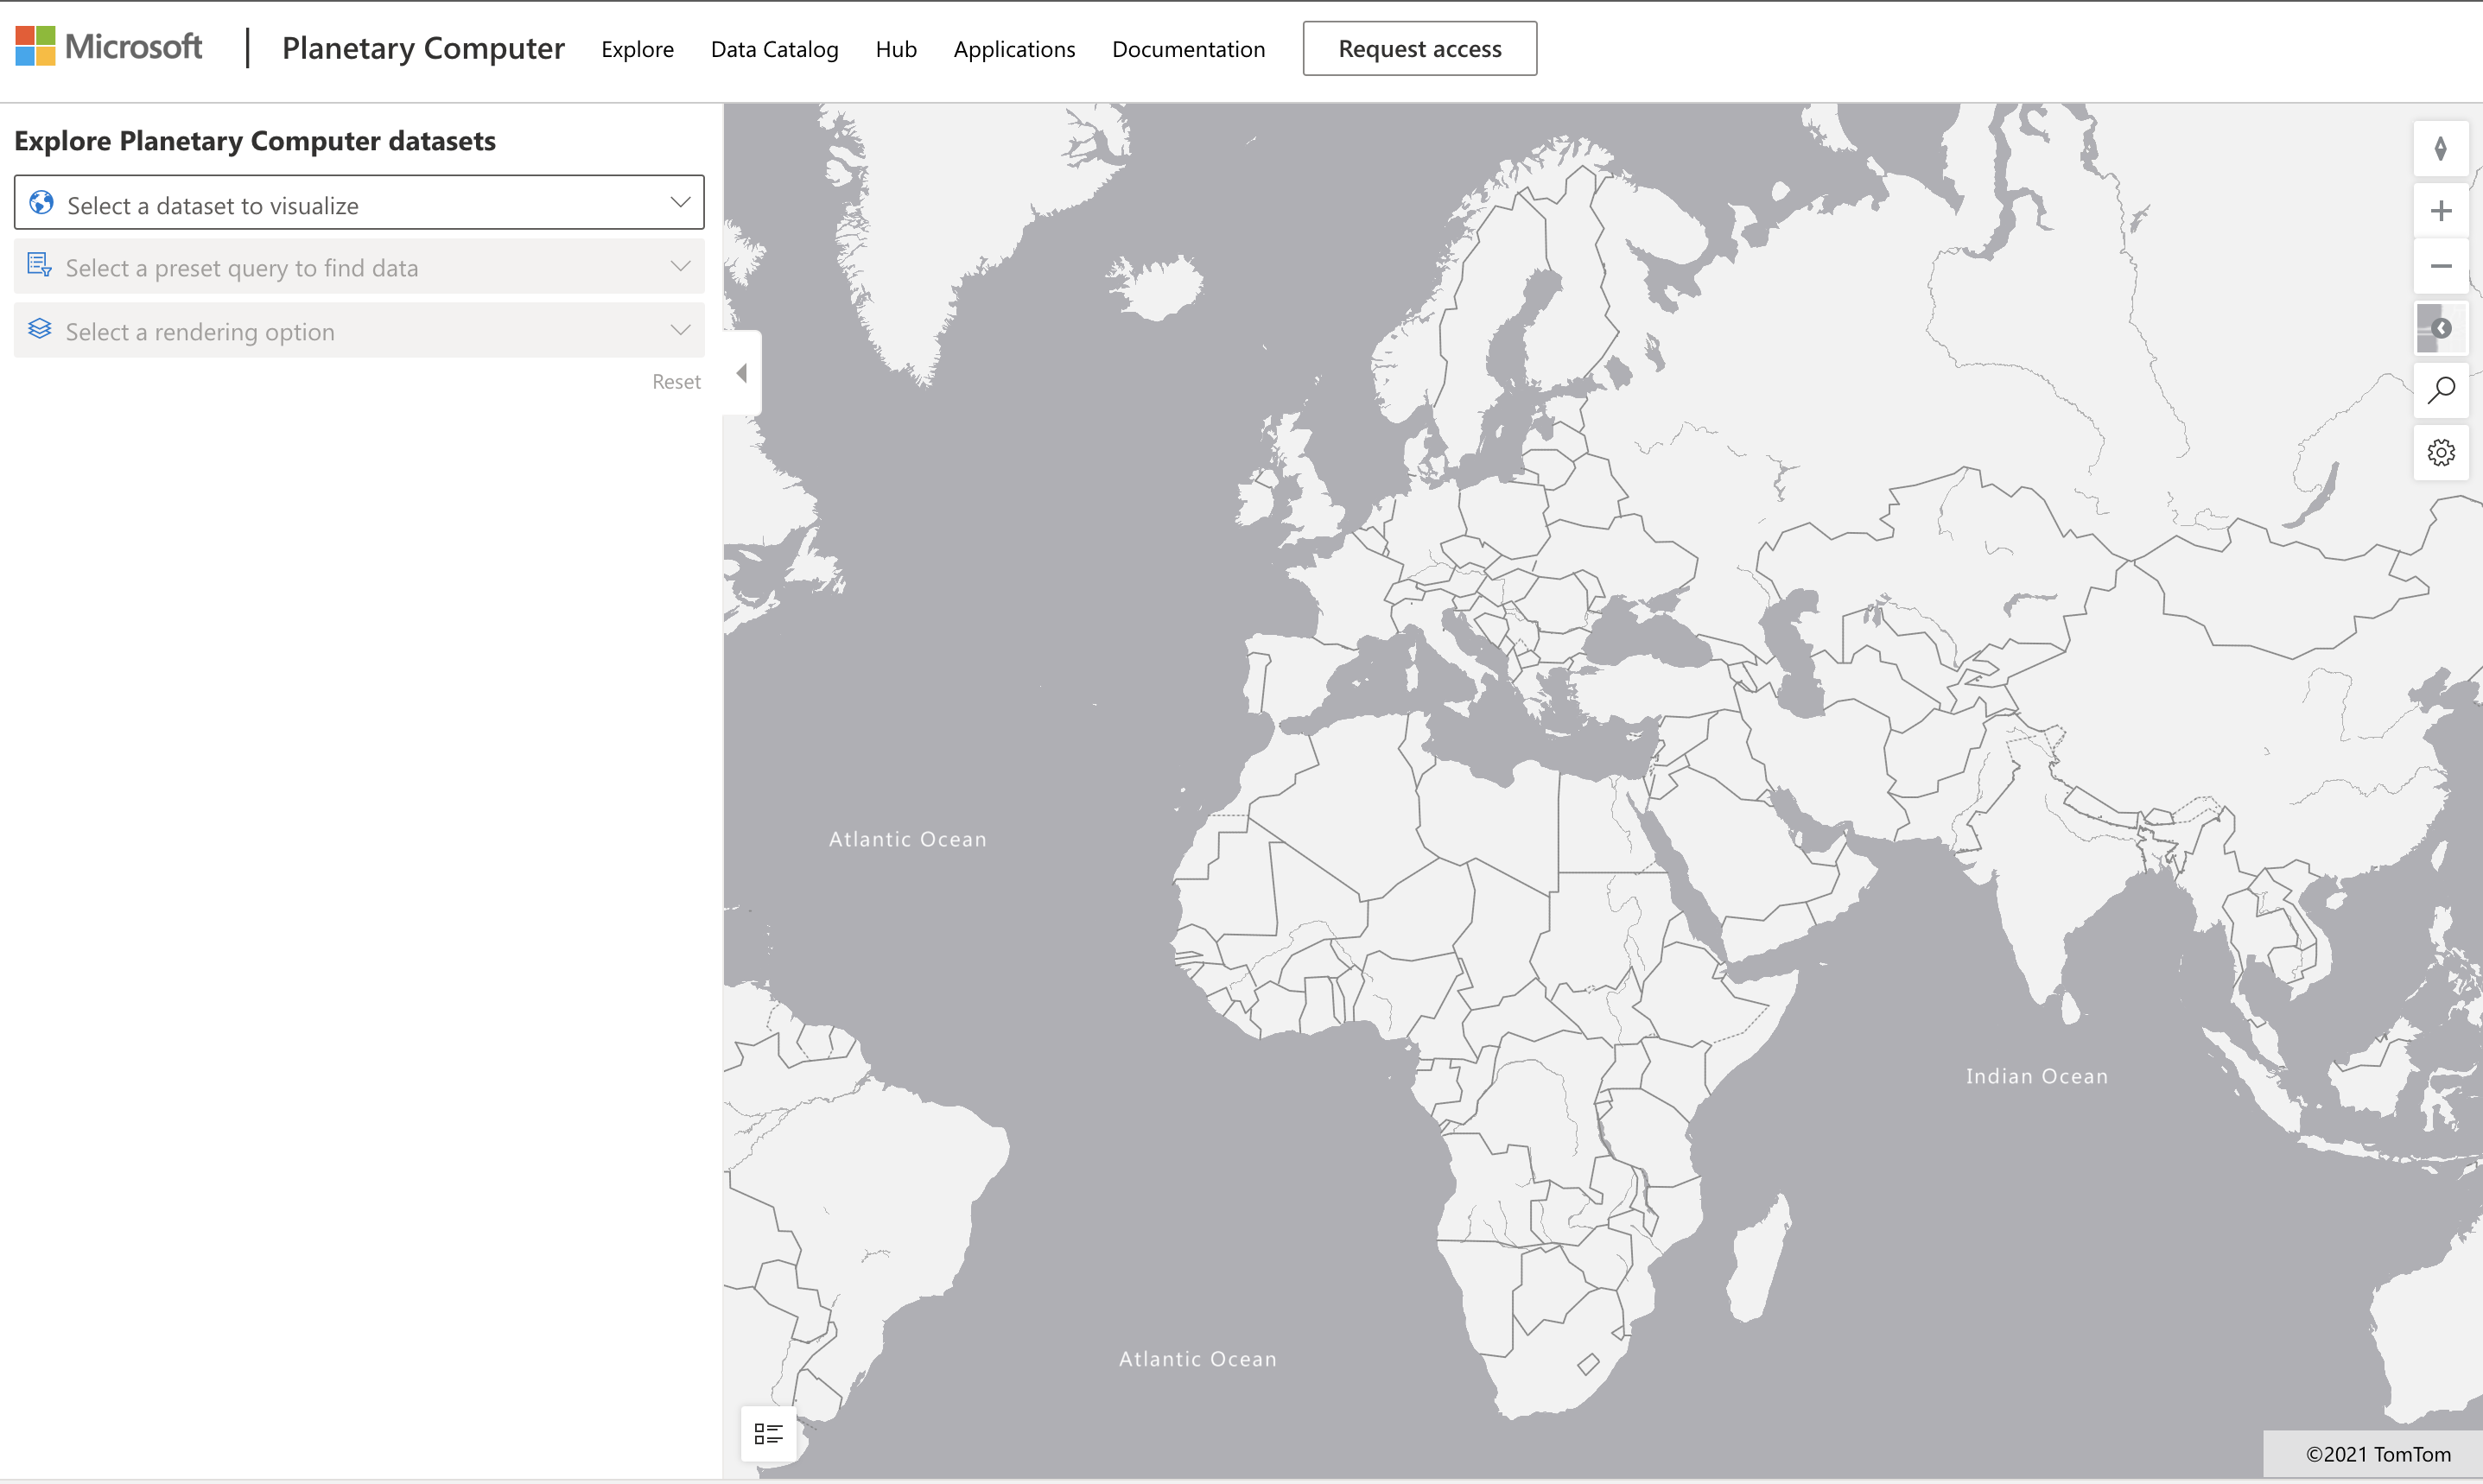
The Explorer interface (shown in the screenshot below) allows you to select a dataset (from the available options), a preset query (to filter the data), and a rendering option (to generate a relevant visualization). For this assignment, your task is to:
- Read the Explorer documentation to understand the available options.
- Explore the dataset Catalog to learn the purpose of each dataset.
- Use the Explorer to choose a dataset of interest, select a relevant query, and pick a rendering option.
Your Task:
Once you've studied the visualization rendered in the browser, answer the following questions:
- What features does the dataset include?
- What insights or results does the visualization reveal?
- What are the implications of those insights for the sustainability goals of the project?
- What are the limitations of the visualization (i.e., what insights were not provided)?
- If you had access to the raw data, what alternative visualizations would you create, and why?
Bonus Points:
Apply for an account and log in once accepted.
- Use the Launch Hub option to open the raw data in a Notebook.
- Explore the data interactively and implement the alternative visualizations you envisioned.
- Analyze your custom visualizations—were you able to uncover the insights you missed earlier?
Rubric
| Exemplary | Adequate | Needs Improvement |
|---|---|---|
| All five core questions were answered. The student clearly identified how current and alternative visualizations could provide insights into sustainability objectives or outcomes. | The student answered at least the top three questions in detail, demonstrating practical experience with the Explorer. | The student failed to answer multiple questions or provided insufficient detail, indicating that no meaningful attempt was made for the project. |
Disclaimer:
This document has been translated using the AI translation service Co-op Translator. While we aim for accuracy, please note that automated translations may include errors or inaccuracies. The original document in its native language should be regarded as the authoritative source. For critical information, professional human translation is advised. We are not responsible for any misunderstandings or misinterpretations resulting from the use of this translation.