|
|
6 years ago | |
|---|---|---|
| assets/img | 6 years ago | |
| diagrams | ||
| docs | 6 years ago | |
| resources | ||
| scripts | ||
| templates | ||
| tests | ||
| website | 6 years ago | |
| .gitignore | ||
| CONTRIBUTING.md | ||
| README.md | 6 years ago | |
| autogen.sh | ||
| config.py | ||
| poetry.lock | ||
| pyproject.toml | ||
README.md

Diagrams
Diagram as Code.
Diagrams lets you draw the cloud system architecture in Python code. It was born for prototyping a new system architecture design without any design tools. You can also describe or visualize the existing system architecture as well. Diagrams currently supports three major cloud providers: AWS, Azure, GCP.
Diagram as Code also allows you to tracking the architecture diagram changes on any version control system.
NOTE: It does not control any actual cloud resources nor generate cloud formation or terraform code, but just for drawing the cloud system architecture diagrams.
Getting Started
It uses Graphviz to render the diagram, so you need to install Graphviz to use diagrams. After installing graphviz (or already have it), install the diagrams.
$ pip install diagrams
You can start with quick start. And you can go guides for more details.
Examples
| Grouped Workers | Clustered Web Services | Event Processing |
|---|---|---|
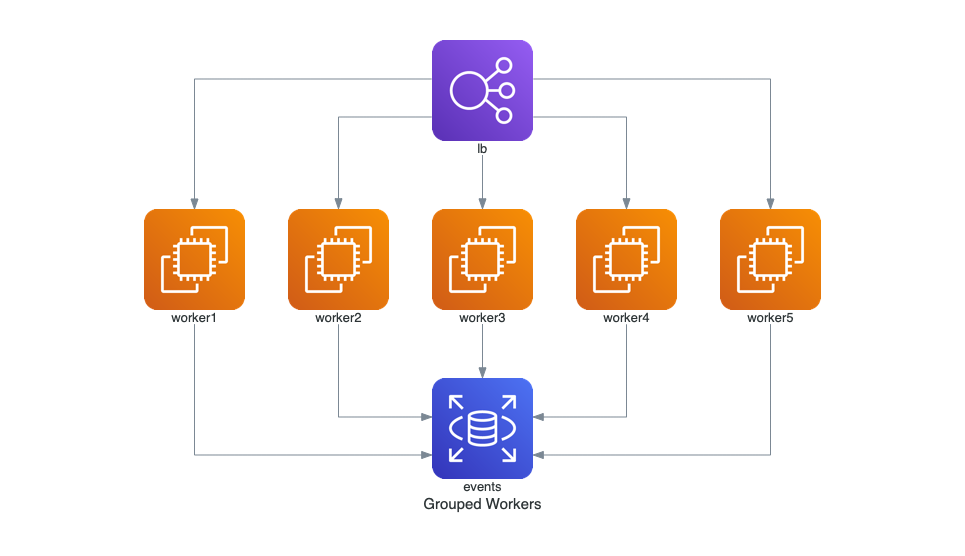 |
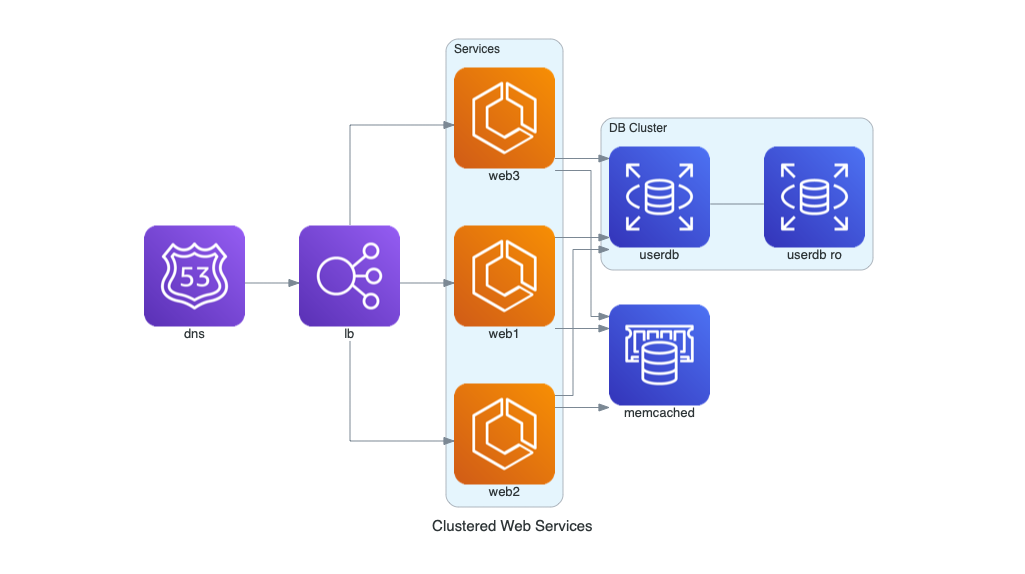 |
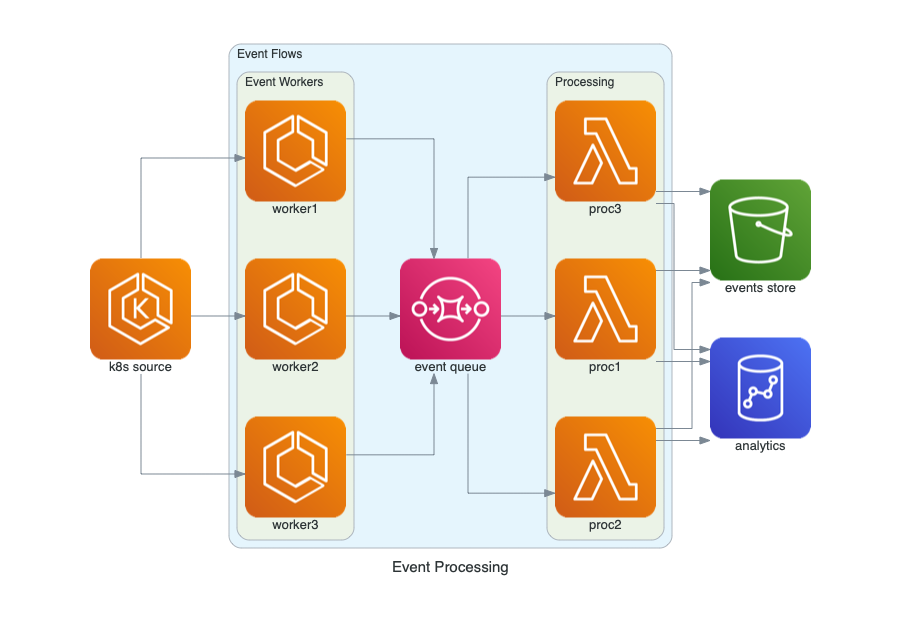 |
You can find all examples in examples page.
Contributing
To contribute to diagram, check out contribution guidelines.
Let me know if you are using diagrams! I'll add you in showcase page. (I'm working on it!) :)