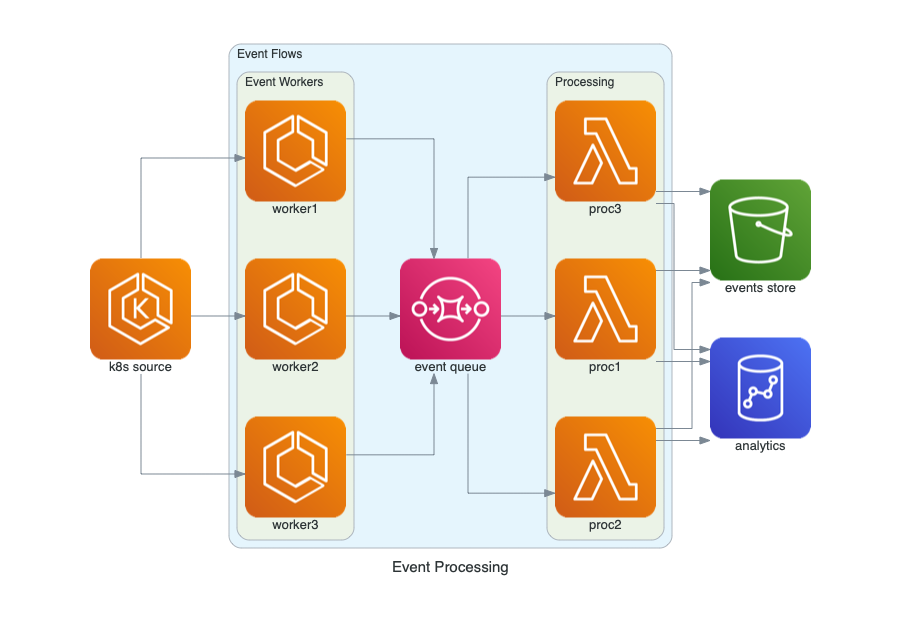
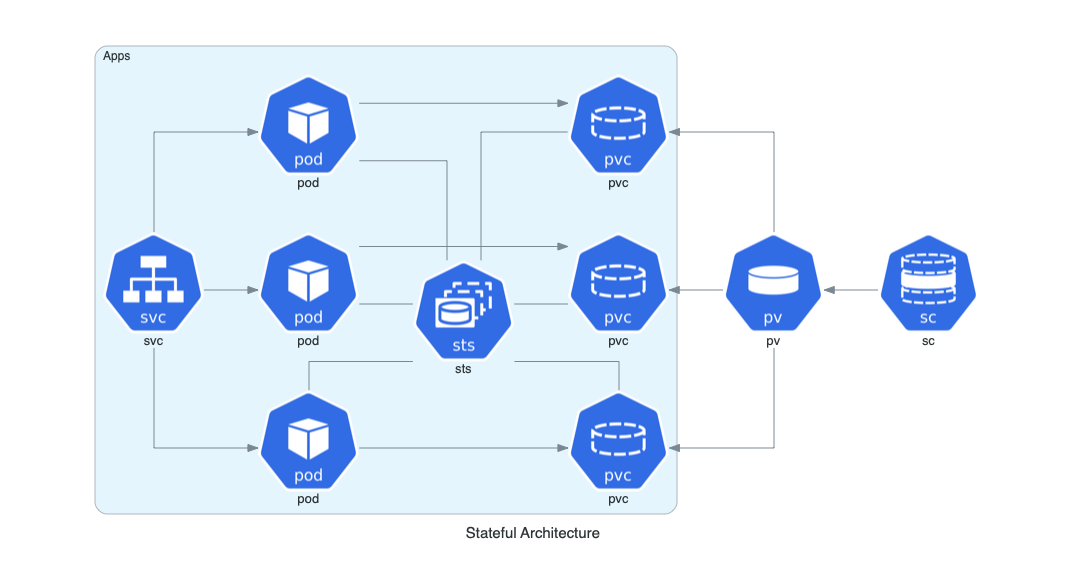
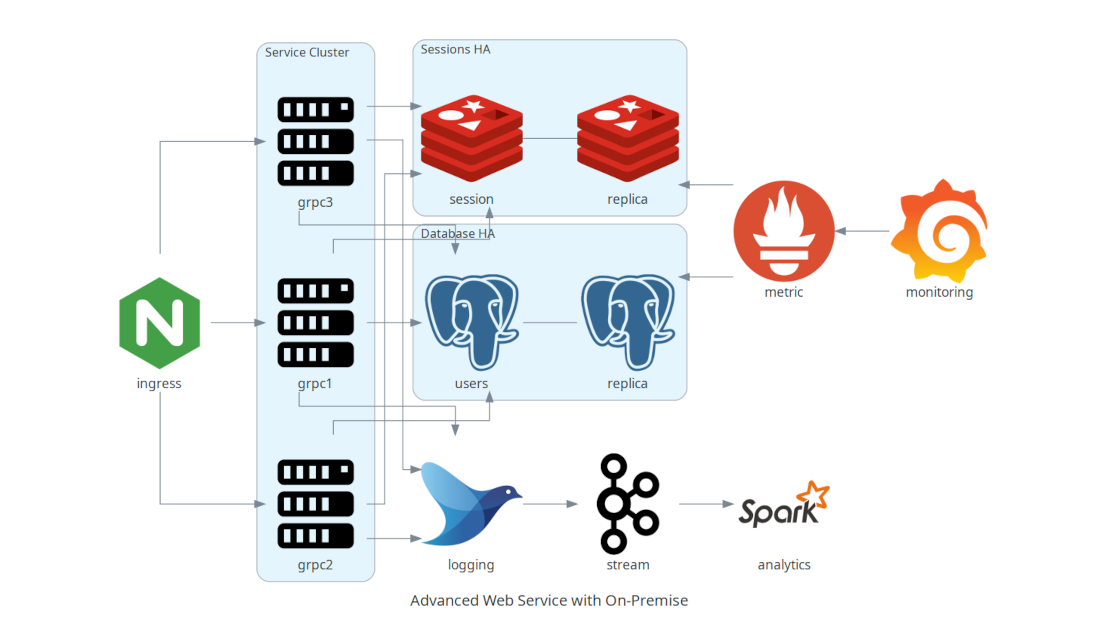
Diagrams lets you draw the cloud system architecture **in Python code**. It was born for **prototyping** a new system architecture design without any design tools. You can also describe or visualize the existing system architecture as well. Diagrams currently supports main major providers including: `AWS`, `Azure`, `GCP`, `Kubernetes`, `Alibaba Cloud`, `Oracle Cloud` etc... It also supports `On-Premise` nodes, `SaaS` and major `Programming` frameworks and languages.
> NOTE: It does not control any actual cloud resources nor does it generate cloud formation or terraform code. It is just for drawing the cloud system architecture diagrams.
It uses [Graphviz](https://www.graphviz.org/) to render the diagram, so you need to [install Graphviz](https://graphviz.gitlab.io/download/) to use **diagrams**. After installing graphviz (or already have it), install the **diagrams**.
You can start with [quick start](https://diagrams.mingrammer.com/docs/getting-started/installation#quick-start). Check out [guides](https://diagrams.mingrammer.com/docs/guides/diagram) for more details, and you can find all available nodes list in [here](https://diagrams.mingrammer.com/docs/nodes/aws).
|  |  |  |
[GitPitch](https://gitpitch.com/) is a markdown presentation service for developers. Diagrams is now integrated as [Cloud Diagram Widget](https://gitpitch.com/docs/diagram-features/cloud-diagrams/) of GitPitch, so you can use the Diagrams when to create slide decks for Tech Conferences, Meetups, and Training with GitPitch.
[Cloudiscovery](https://github.com/Cloud-Architects/cloudiscovery) helps you to analyze resources in your cloud (AWS/GCP/Azure/Alibaba/IBM) account. It allows you to create a diagram of analyzed cloud resource map based on this Diagrams library, so you can draw the your existing cloud infrastructure with Cloudicovery.
[Airflow Diagrams](https://github.com/feluelle/airflow-diagrams) is an Airflow plugin that aims to easily visualise your Airflow DAGs on service level from providers like AWS, GCP, Azure, etc. via diagrams.