15 KiB
Browser Extension Project Part 3: Learn about Background Tasks and Performance
Background tasks and performance optimization are the invisible engines that power exceptional web experiences. While users interact with your browser extension's interface, behind the scenes your code is managing data fetching, icon updates, and system resources. Understanding how to optimize these processes transforms a functional extension into a professional, efficient tool that users love.
In this final lesson of the browser extension module, you'll complete your carbon footprint tracker by implementing dynamic icon updates and learning essential performance monitoring techniques. You'll discover how browsers manage background processes, explore the tools that help you identify performance bottlenecks, and apply optimization strategies that make your extension lightning-fast.
By the end of this lesson, you'll have a fully functional browser extension and the knowledge to build performant web applications that scale beautifully. Let's dive into the world of browser performance and bring your extension to life!
Pre-Lecture Quiz
Introduction
In the last two lessons of this module, you learned how to build a form and display area for data fetched from an API. It's a very standard way of creating a web presence on the web. You even learned how to handle fetching data asynchronously. Your browser extension is very nearly complete.
It remains to manage some background tasks, including refreshing the color of the extension's icon, so this is a great time to talk about how the browser manages this kind of task. Let's think about these browser tasks in the context of the performance of your web assets as you build them.
Web Performance Basics
Web performance is the foundation of user experience on the modern web. When your code runs efficiently, users feel the difference in every interaction - from instant page loads to smooth animations and responsive interfaces. Understanding performance isn't just about making things faster; it's about creating web experiences that feel magical rather than frustrating.
Let's explore the tools and techniques that help you measure and optimize your web applications. We'll start with browser-based profiling tools, then apply these concepts to optimize your browser extension.
"Website performance is about two things: how fast the page loads, and how fast the code on it runs." -- Zack Grossbart
The topic of how to make your websites blazingly fast on all kinds of devices, for all kinds of users, in all kinds of situations, is unsurprisingly vast. Here are some points to keep in mind as you build either a standard web project or a browser extension.
The first thing you need to do to ensure that your site is running efficiently is to gather data about its performance. The first place to do this is in the developer tools of your web browser. In Edge, you can select the "Settings and more" button (the three dots icon on the top right of the browser), then navigate to More Tools > Developer Tools and open the Performance tab. You can also use the keyboard shortcuts Ctrl + Shift + I on Windows or Option + Command + I on Mac to open developer tools.
Here's how to get started with performance profiling:
- Opens the Developer Tools using the keyboard shortcut or menu option
- Navigates to the Performance tab to access profiling tools
- Records a performance session while your page loads or runs
- Analyzes the results to identify bottlenecks and optimization opportunities
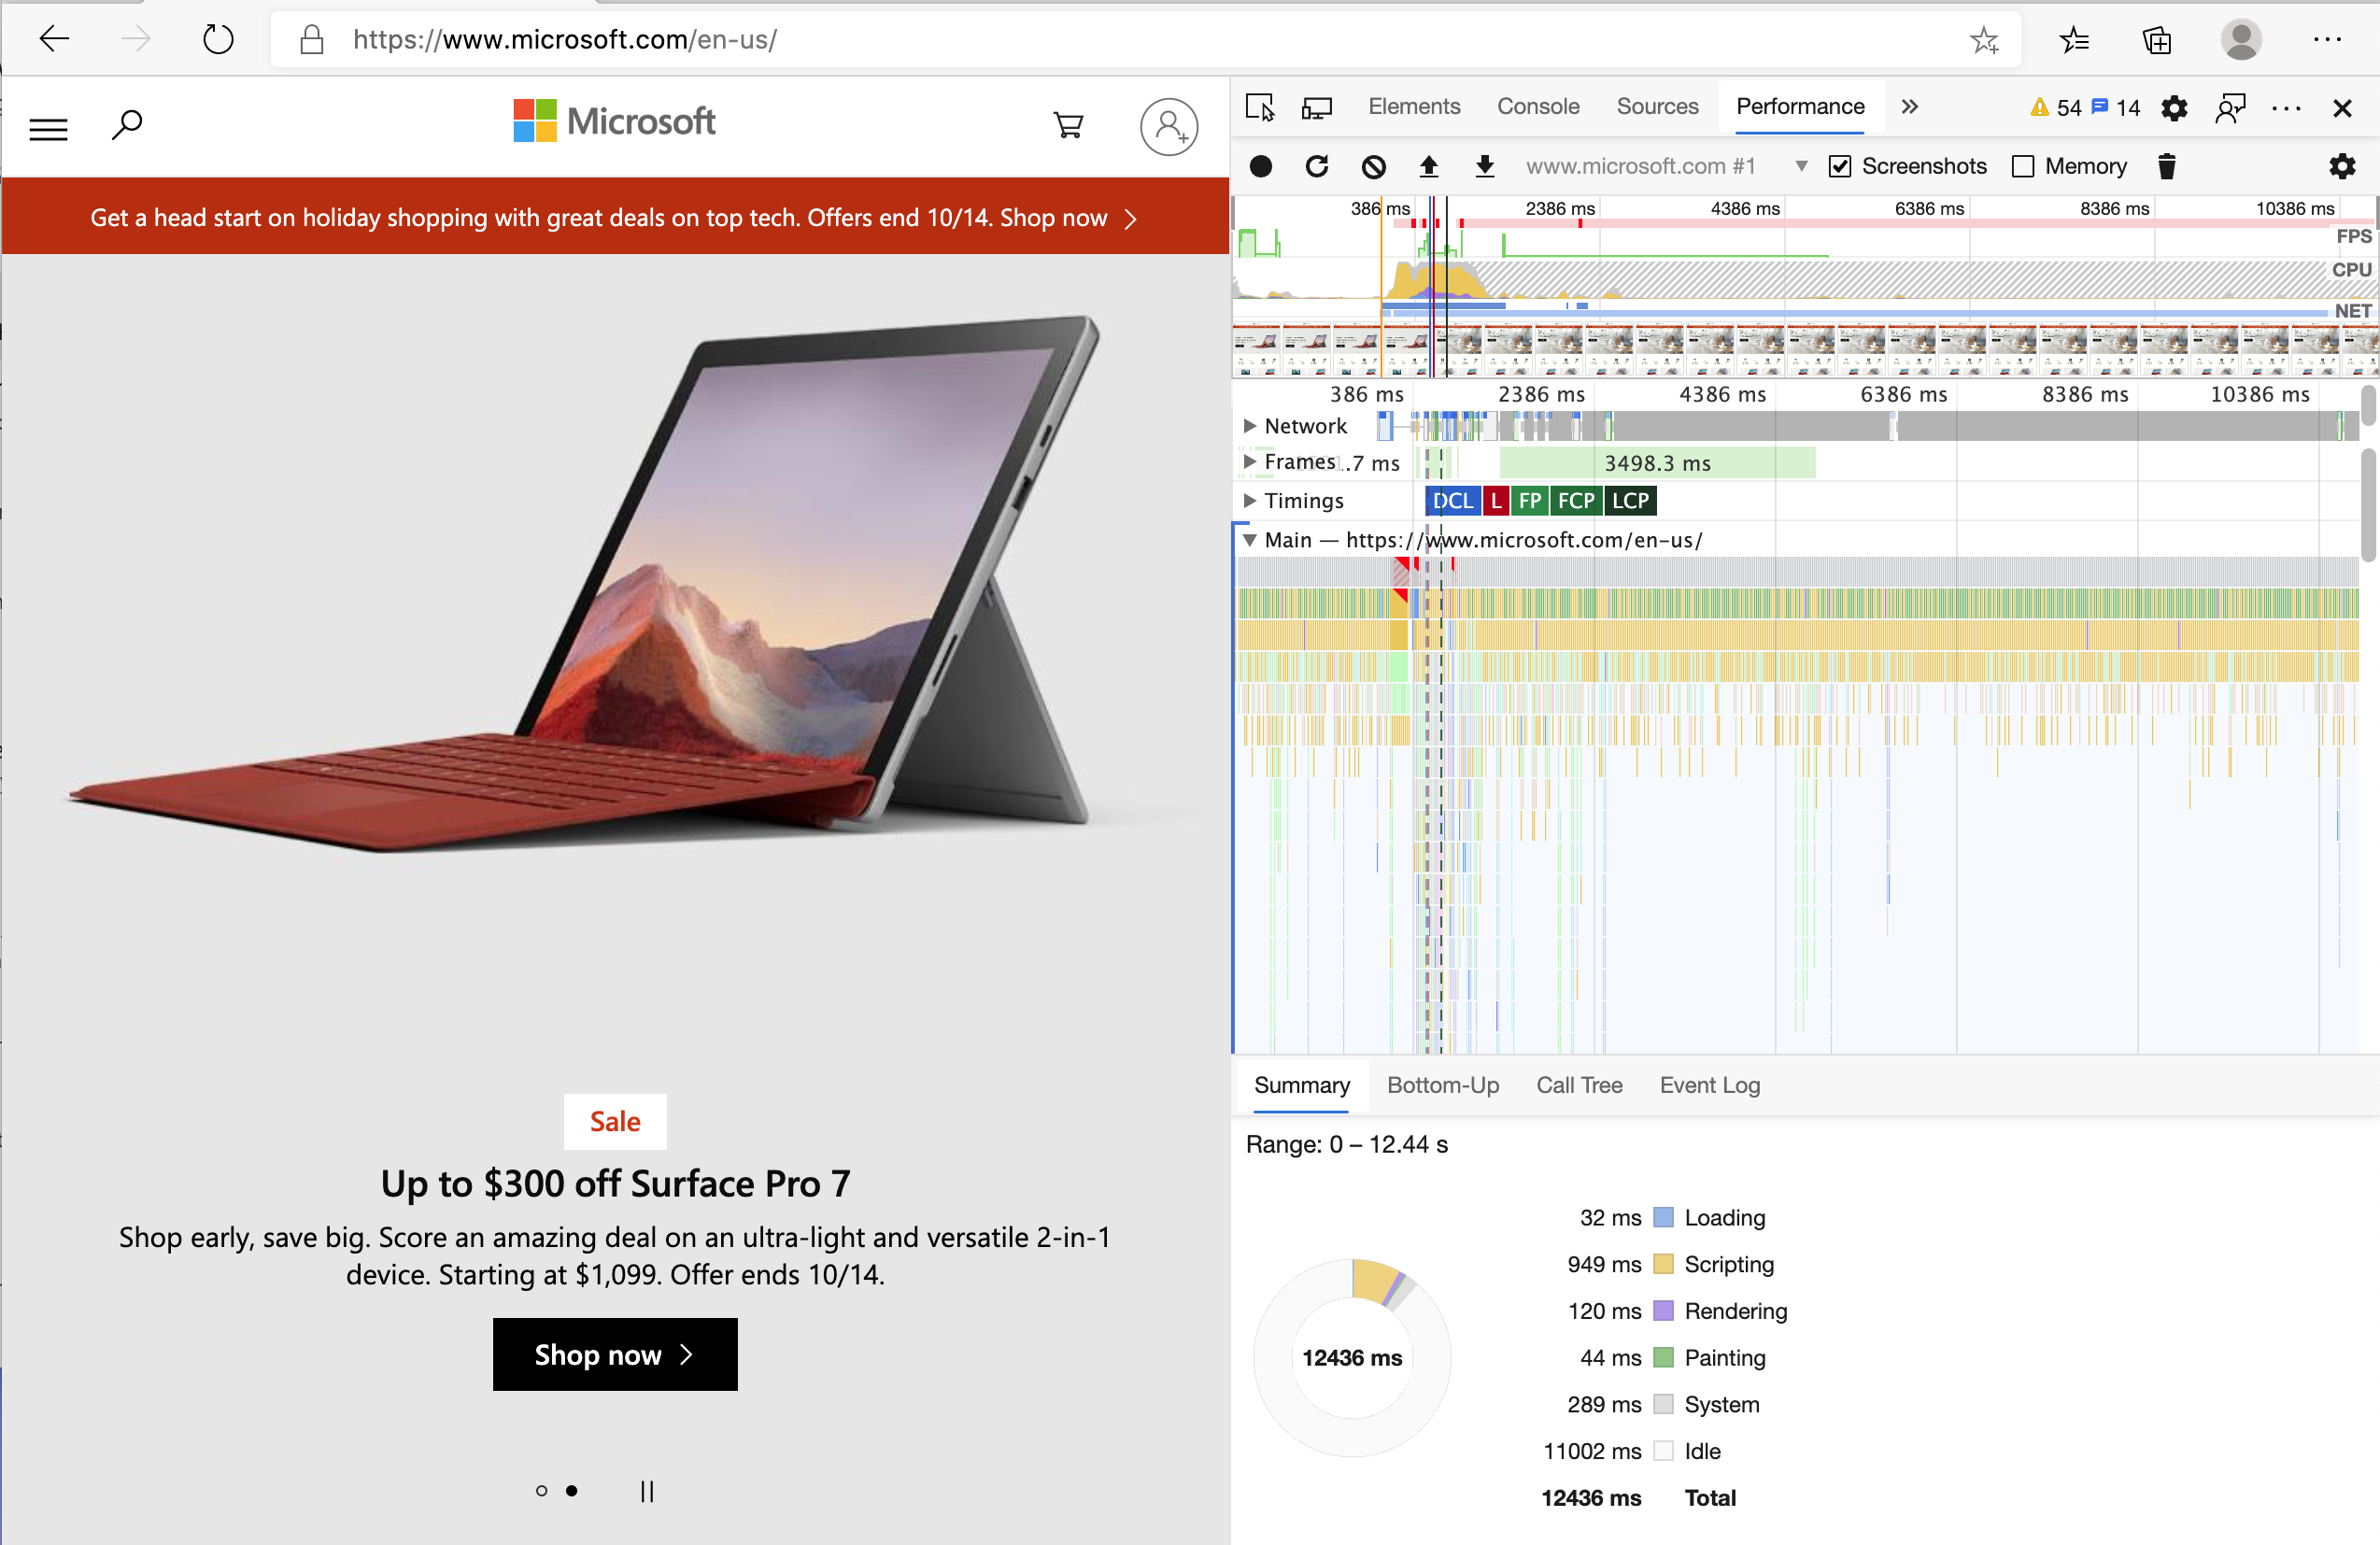
The Performance tab contains a Profiling tool. Open a website (try, for example, https://www.microsoft.com) and click the 'Record' button, then refresh the site. Stop the recording at any time, and you will be able to see the routines that are generated to 'script', 'render', and 'paint' the site:
✅ Visit the Microsoft Documentation on the Performance panel in Edge
Tip: to get an accurate reading of your website's startup time, clear your browser's cache
Select elements of the profile timeline to zoom in on events that happen while your page loads.
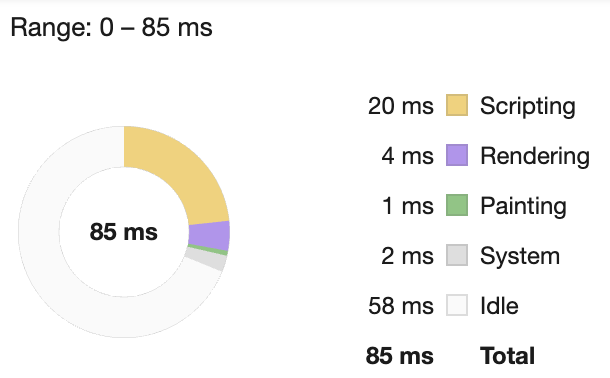
Get a snapshot of your page's performance by selecting a part of the profile timeline and looking at the summary pane:
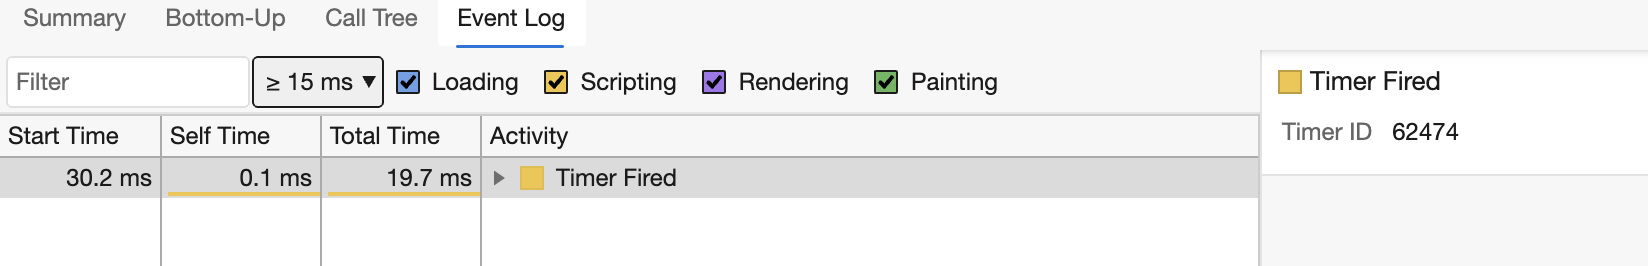
Check the Event Log pane to see if any event took longer than 15 ms:
✅ Get to know your profiler! Open the developer tools on this site and see if there are any bottlenecks. What's the slowest-loading asset? The fastest?
Profiling checks
Effective performance profiling goes beyond just running the tools - it requires knowing what to look for and how to interpret the data. Experienced developers have learned to spot common performance patterns that can make or break user experience.
Let's examine the key areas where performance issues typically emerge and how to identify them before they become problems in production.
In general, there are some "problem areas" that every web developer should watch for when building a site to avoid nasty surprises when it's time to deploy to production.
Asset sizes: The web has gotten 'heavier', and thus slower, over the past few years. Some of this weight has to do with the use of images.
✅ Look through the Internet Archive for a historical view of page weight and more.
Best practices for asset optimization:
- Compresses images using modern formats like WebP or AVIF
- Serves appropriately sized images for different screen resolutions
- Minifies CSS and JavaScript files to reduce download size
- Implements lazy loading for images and content below the fold
DOM traversals: The browser has to build its Document Object Model based on the code you write, so it's in the interest of good page performance to keep your tags minimal, only using and styling what the page needs. To this point, excess CSS associated with a page could be optimized; styles that need to be used only on one page don't need to be included in the main style sheet, for example.
Key strategies for DOM optimization:
- Minimizes the number of HTML elements and nesting levels
- Removes unused CSS rules and consolidates stylesheets efficiently
- Organizes CSS to load only what's needed for each page
- Structures HTML semantically for better browser parsing
JavaScript: Every JavaScript developer should watch for 'render-blocking' scripts that must be loaded before the rest of the DOM can be traversed and painted to the browser. Consider using defer with your inline scripts (as is done in the Terrarium module).
Modern JavaScript optimization techniques:
- Uses the
deferattribute to load scripts after DOM parsing - Implements code splitting to load only necessary JavaScript
- Applies lazy loading for non-critical functionality
- Minimizes the use of heavy libraries and frameworks when possible
✅ Try some sites on a Site Speed Test website to learn more about the common checks that are done to determine site performance.
Now that you have an idea of how the browser renders the assets you send to it, let's look at the last few things you need to do to complete your extension:
Create a function to calculate color
Now we'll implement the core logic that transforms CO2 data into a visual indicator. This function will take the carbon intensity value from our API and map it to an appropriate color that reflects the environmental impact.
Working in /src/index.js, add a function called calculateColor() after the series of const variables you set to gain access to the DOM:
function calculateColor(value) {
	// Define CO2 intensity scale (grams per kWh)
	const co2Scale = [0, 150, 600, 750, 800];
	// Corresponding colors from green (clean) to dark brown (high carbon)
	const colors = ['#2AA364', '#F5EB4D', '#9E4229', '#381D02', '#381D02'];

	// Find the closest scale value to our input
	const closestNum = co2Scale.sort((a, b) => {
		return Math.abs(a - value) - Math.abs(b - value);
	})[0];

	console.log(`${value} is closest to ${closestNum}`);

	// Find the index for color mapping
	const num = (element) => element > closestNum;
	const scaleIndex = co2Scale.findIndex(num);

	const closestColor = colors[scaleIndex];
	console.log(scaleIndex, closestColor);

	// Send color update message to background script
	chrome.runtime.sendMessage({ action: 'updateIcon', value: { color: closestColor } });
}
Breaking down what happens here:
- Defines arrays for CO2 intensity scale and corresponding colors
- Calculates the closest scale value using array sorting and Math.abs()
- Finds the appropriate color index using findIndex() method
- Sends a message to the Chrome runtime with the selected color
- Uses template literals for cleaner string formatting
- Applies const declarations for values that don't change
The chrome.runtime has an API that handles all kinds of background tasks, and your extension is leveraging that:
"Use the chrome.runtime API to retrieve the background page, return details about the manifest, and listen for and respond to events in the app or extension lifecycle. You can also use this API to convert the relative path of URLs to fully-qualified URLs."
Understanding Chrome Runtime API benefits:
- Manages communication between different parts of your extension
- Handles background tasks without blocking the user interface
- Provides lifecycle management for extension events
- Enables message passing between content scripts and background scripts
✅ If you're developing this browser extension for Edge, it might surprise you that you're using a chrome API. The newer Edge browser versions run on the Chromium browser engine, so you can leverage these tools.
Pro Tip: If you want to profile a browser extension, launch the dev tools from within the extension itself, as it is its own separate browser instance. This gives you access to extension-specific performance metrics.
Set a default icon color
Before we fetch real data, it's important to initialize our extension with a default state. This provides immediate visual feedback to users and ensures the extension appears functional from the moment it loads.
Now, in the init() function, set the icon to be generic green to start by again calling chrome's updateIcon action:
chrome.runtime.sendMessage({
	action: 'updateIcon',
	value: {
		color: 'green',
	},
});
What this initialization accomplishes:
- Sets a neutral green color as the default state
- Provides immediate visual feedback when the extension loads
- Establishes the communication pattern with the background script
- Ensures users see a functional extension before data loads
Call the function, execute the call
Now we'll integrate our color calculation function with the API data flow. This connects the data retrieval process with the visual indicator system, creating a seamless user experience.
Next, call that function you just created by adding it to the promise returned by the C02Signal API:
// After retrieving CO2 data from the API
// let CO2 = data.data[0].intensity.actual;
calculateColor(CO2);
This integration accomplishes:
- Connects the API data flow with the visual indicator system
- Triggers icon updates automatically when new data arrives
- Ensures real-time visual feedback based on current carbon intensity
- Maintains the separation of concerns between data fetching and display logic
And finally, in /dist/background.js, add the listener for these background action calls:
// Listen for messages from the content script
chrome.runtime.onMessage.addListener(function (msg, sender, sendResponse) {
	if (msg.action === 'updateIcon') {
		chrome.action.setIcon({ imageData: drawIcon(msg.value) });
	}
});

// Draw dynamic icon using Canvas API
// Borrowed from energy lollipop extension - nice feature!
function drawIcon(value) {
	// Create an offscreen canvas for better performance
	const canvas = new OffscreenCanvas(200, 200);
	const context = canvas.getContext('2d');

	// Draw a colored circle representing carbon intensity
	context.beginPath();
	context.fillStyle = value.color;
	context.arc(100, 100, 50, 0, 2 * Math.PI);
	context.fill();

	// Return the image data for the browser icon
	return context.getImageData(50, 50, 100, 100);
}
Understanding the background script functionality:
- Listens for messages from content scripts using runtime.onMessage
- Processes 'updateIcon' actions to change the extension's toolbar icon
- Creates dynamic icons using the Canvas API and OffscreenCanvas
- Draws a colored circle that reflects current carbon intensity levels
- Updates the browser toolbar with the newly generated icon image
- Uses OffscreenCanvas for better performance in background contexts
✅ You'll learn more about the Canvas API in the Space Game lessons.
Testing your completed extension:
- Build your extension using
npm run build - Reload the extension in your browser's extension management page
- Launch your extension and watch the color change based on current data
- Monitor how the icon updates reflect real-time carbon intensity
Is it a good time to run an errand or wash the dishes? Now you know!
Congratulations, you've built a useful browser extension and learned more about how the browser works and how to profile its performance.
GitHub Copilot Agent Challenge 🚀
Use the Agent mode to complete the following challenge:
Description: Enhance the browser extension's performance monitoring capabilities by adding a feature that tracks and displays load times for different components of the extension.
Prompt: Create a performance monitoring system for the browser extension that measures and logs the time it takes to fetch CO2 data from the API, calculate colors, and update the icon. Add a function called performanceTracker that uses the Performance API to measure these operations and displays the results in the browser console with timestamps and duration metrics.
🚀 Challenge
Investigate some open source websites that have been around a long time, and, based on their GitHub history, see if you can determine how they were optimized over the years for performance, if at all. What is the most common pain point?
Research approach:
- Examines commit history for performance-related changes
- Identifies patterns in optimization strategies over time
- Analyzes common performance bottlenecks across different projects
- Documents your findings and shares insights with the community
Post-Lecture Quiz
Review & Self Study
Consider signing up for a performance newsletter
Investigate some of the ways that browsers gauge web performance by looking through the performance tabs in their web tools. Do you find any major differences?