
 localizeflow[bot]
03503248d2
localizeflow[bot]
03503248d2
|
3 weeks ago | |
|---|---|---|
| .. | ||
| solution | 8 months ago | |
| README.md | 3 weeks ago | |
| assignment.md | 8 months ago | |
| notebook.ipynb | 11 months ago | |
README.md
Start wit Python and Scikit-learn for regression models
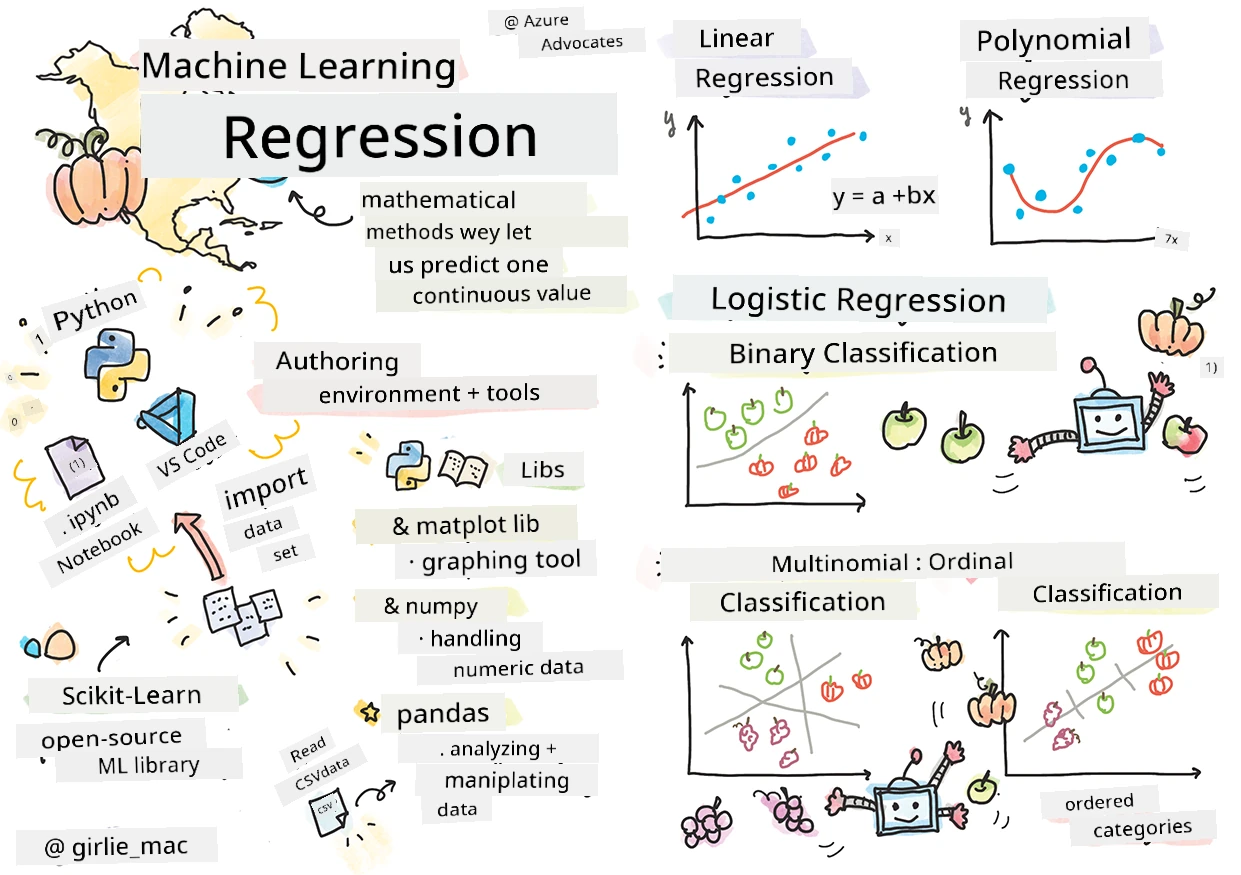
Sketchnote by Tomomi Imura
Pre-lecture quiz
Dis lesson dey R too!
Introduction
For dis four lessons, you go sabi how to build regression models. We go talk wetin dem be for shortly. But before you start anything, make sure say you get correct tools to begin de process!
For dis lesson, you go learn how to:
- Configure your computer for local machine learning tasks.
- Work with Jupyter Notebooks.
- Use Scikit-learn, including installation.
- Explore linear regression with a hands-on exercise.
Installations and configurations
🎥 Click the image above for a short video working through configuring your computer for ML.
-
Install Python. Make sure say Python dey installed for your computer. You go use Python for plenty data science and machine learning tasks. Most computer systems don already get Python wey dem install. Some useful Python Coding Packs also dey to help some users set up easily.
Some Python uses dem need one kain version, others need another version. Na why e good to dey work inside one virtual environment.
-
Install Visual Studio Code. Make sure say Visual Studio Code dey your computer. Follow dis instructions to install Visual Studio Code for the basic installation. You go use Python for Visual Studio Code for dis course, so e good make you sabi how to configure Visual Studio Code for Python development.
Make yourself comfortable with Python by working through dis pack of Learn modules
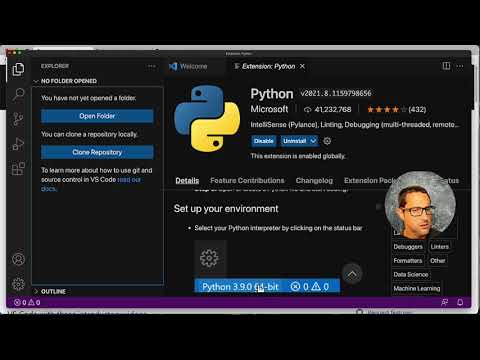
🎥 Click the image above for one video: how to use Python inside VS Code.
-
Install Scikit-learn, by following these instructions. Because you need make sure say you dey use Python 3, e better make you use virtual environment. If you dey install this library for M1 Mac, different instructions dey the page wey I link.
-
Install Jupyter Notebook. You need install the Jupyter package.
Your ML authoring environment
You go use notebooks to write your Python code and create machine learning models. Dis kain file na common tool for data scientists, and you fit know dem by the suffix or extension .ipynb.
Notebooks dey interactive environment wey allow developer to both code and add notes and write documentation around the code which helpful for experimental or research work.
🎥 Click the image above for short video wey go work through this exercise.
Exercise - work with notebook
For dis folder, you go see file notebook.ipynb.
-
Open notebook.ipynb for Visual Studio Code.
One Jupyter server go start with Python 3+ dey run. You go see areas for notebook wey you fit
run, code pieces. You fit run code block by choosing the play button icon. -
Choose
mdicon and add small markdown, add dis text # Welcome to your notebook.Next, add some Python code.
-
Write print('hello notebook') for code block.
-
Choose arrow to run code.
You go see the printed statement:
hello notebook

You fit mix your code wit comments to better document the notebook.
✅ Take one minute think how di working environment of web developer different from data scientist one.
Up and running with Scikit-learn
Now we don set up Python for your local environment, and you don get familiar with Jupyter Notebooks, make we also make Scikit-learn easy for you (pronounce am sci like science). Scikit-learn get extensive API to help you do ML tasks.
According to their website, "Scikit-learn na open source machine learning library wey support supervised and unsupervised learning. E also get tools for model fitting, data preprocessing, model selection and evaluation, and many other utilities."
For dis course, you go use Scikit-learn and other tools to build ML models to perform wetin we dey call 'traditional machine learning' tasks. We no include neural networks and deep learning because dem go do dat one for our 'AI for Beginners' curriculum wey dey come soon.
Scikit-learn make e easy to build models and test dem for use. E mainly focus on numeric data and get plenty ready datasets as learning tools. E get pre-built models wey students fit use try. Make we explore how to load prepackaged data and use built-in estimator to create your first ML model with Scikit-learn wit simple data.
Exercise - your first Scikit-learn notebook
Dis tutorial come from the linear regression example wey dey for Scikit-learn website.
🎥 Click the image above for short video wey go work through dis exercise.
For notebook.ipynb file wey join dis lesson, clear all cells by pressing the 'trash can' icon.
For dis section, you go use small dataset about diabetes wey Scikit-learn get for learning. Imagine say you dey try treatment for diabetic patients. Machine Learning models fit help you know who go respond well to di treatment, based on different variable combination dem. Even basic regression model, if you show am for graph, fit give info about variables wey fit help you plan your clinical trials.
✅ Plenty types of regression method dey, and the one to pick depend on the answer wey you dey find. If you wan predict probable height for person wey get given age, you go use linear regression because you dey find numeric value. If you dey interested to find if one type of food na vegan or no, you go look for category assignment so you go use logistic regression. You go learn more about logistic regression later. Try think about some questions you fit ask data, and which method dey best for dem.
Make we start dis task.
Import libraries
For dis task, we go import some libraries:
- matplotlib. Na better graphing tool and we go use am to make line plot.
- numpy. numpy na good library for numeric data for Python.
- sklearn. Na the Scikit-learn library.
Import libraries to help you do your work.
-
Add imports by typing dis code:
import matplotlib.pyplot as plt
import numpy as np
from sklearn import datasets, linear_model, model_selection
For up, you dey import
matplotlib,numpyand fromsklearnyou dey importdatasets,linear_modelandmodel_selection.model_selectionna for split data into training and test sets.
The diabetes dataset
The built-in diabetes dataset get 442 data samples about diabetes, with 10 features, some of dem be:
- age: age for years
- bmi: body mass index
- bp: average blood pressure
- s1 tc: T-Cells (one type of white blood cells)
✅ Dis dataset get 'sex' as feature variable wey important for research about diabetes. Many medical datasets get this kind binary classification. Think how this kind classification fit exclude some people from treatments.
Now, make you load the X and y data.
🎓 Remember, na supervised learning dis, so we need named 'y' target.
For new code cell, load the diabetes dataset by calling load_diabetes(). The return_X_y=True mean say X go be data matrix, y go be regression target.
-
Add print command to show the shape of the data matrix and the first element:
X, y = datasets.load_diabetes(return_X_y=True)
print(X.shape)
print(X[0])
Wetin you dey get back na tuple. You dey assign the first two values of the tuple to
Xandy. Learn more about tuples.You go see say this data get 442 items arranged in arrays of 10 elements:
(442, 10)
[ 0.03807591  0.05068012  0.06169621  0.02187235 -0.0442235  -0.03482076
-0.04340085 -0.00259226  0.01990842 -0.01764613]
✅ Think about the relationship between data and regression target. Linear regression dey predict relationships between feature X and target variable y. Fit you find the target for diabetes dataset for the documentation? Wetin dis dataset dey show about dat target?
-
Next, select part of this dataset to plot by selecting the 3rd column. You fit do dis by use
:operator for select all rows, then select 3rd column with index (2). You also fit reshape data to be 2D array - as e dey needed for plot - by usingreshape(n_rows, n_columns). If one parameter na -1, that dimension go calculate automatically.X = X[:, 2] X = X.reshape((-1,1))✅ Anytime, you fit print data make you check the shape.
-
Now as you get data ready to plot, you fit see if machine fit help decide logical split between numbers wey dey this dataset. To do dis, you need split data (X) and target (y) into test and training sets. Scikit-learn get simple way to do dis; you fit split test data from certain point.
X_train, X_test, y_train, y_test = model_selection.train_test_split(X, y, test_size=0.33) -
Now you ready to train your model! Load linear regression model and train am with your X and y training sets using
model.fit():model = linear_model.LinearRegression() model.fit(X_train, y_train)✅
model.fit()na function wey many ML libraries like TensorFlow dey use too -
Then create prediction using test data with
predict(). Dis go use draw line between data groupsy_pred = model.predict(X_test) -
Now na time to show data for plot. Matplotlib na useful tool for dis task. Make scatterplot for all X and y test data, use prediction to draw line for best place, between model's data groups.
plt.scatter(X_test, y_test,  color='black')
plt.plot(X_test, y_pred, color='blue', linewidth=3)
plt.xlabel('Scaled BMIs')
plt.ylabel('Disease Progression')
plt.title('A Graph Plot Showing Diabetes Progression Against BMI')
plt.show()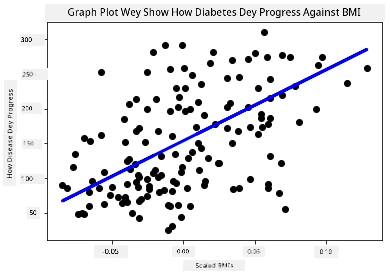
✅ Think about wetin dey happen here. A straight line dae run through small dots of data, but wetin e dey really do? Can you see how dis line fit help predict where new, unseen data point go fit based on the y axis? Try talk wetin this model go fit do for practical.
Congrats, you don build your first linear regression model, create prediction, and show am for plot!
🚀Challenge
Plot different variable from this dataset. Hint: change dis line: X = X[:,2]. Based on dis dataset target, wetin you fit discover about diabetes progression as disease?
Post-lecture quiz
Review & Self Study
For dis tutorial, you use simple linear regression instead of univariate or multiple linear regression. Read about differences between dis methods, or watch this video
Read more about di concept of regression and tink about wetin kain questions dis techniks fit answer. Make you take dis tutorial to sabi am well well.
Assignment
Disclaimer: Dis document don translate wit AI translation service Co-op Translator. Even tho we dey try make am correct, abeg make you know say automated translation fit get errors or mistakes. Di original document for dia own language na im be di correct source. For important info, make person wey sabi human translation do am. We no go responsible for any misunderstanding or wrong understanding wey fit happen because of dis translation.