|
|
2 weeks ago | |
|---|---|---|
| .. | ||
| solution | 2 weeks ago | |
| README.md | 2 weeks ago | |
| assignment.md | 2 weeks ago | |
| notebook.ipynb | 2 weeks ago | |
README.md
Clustering ကိုမိတ်ဆက်ခြင်း
Clustering သည် Unsupervised Learning အမျိုးအစားတစ်ခုဖြစ်ပြီး၊ dataset တွင် label မပါရှိခြင်း သို့မဟုတ် input များကို predefined output များနှင့်မတူညီခြင်းကိုယူဆသည်။ Clustering သည် unlabeled data များကိုစီစဉ်ရန်အတွက် အမျိုးမျိုးသော algorithm များကိုအသုံးပြုပြီး၊ data တွင်တွေ့ရှိသော pattern များအပေါ်အခြေခံ၍ အုပ်စုများကိုဖော်ထုတ်ပေးသည်။

🎥 အထက်ပါပုံကိုနှိပ်ပြီး video ကိုကြည့်ပါ။ Clustering ဖြင့် machine learning ကိုလေ့လာနေစဉ်၊ Nigerian Dance Hall သီချင်းများကိုခံစားပါ - PSquare ၏ 2014 ခုနှစ်မှ highly rated သီချင်းတစ်ပုဒ်ဖြစ်သည်။
Pre-lecture quiz
မိတ်ဆက်
Clustering သည် data exploration အတွက် အလွန်အသုံးဝင်သည်။ Nigerian audience များ၏ music စားသုံးပုံစံများတွင် trend များနှင့် pattern များကိုဖော်ထုတ်နိုင်မလားဆိုတာကြည့်ကြမယ်။
✅ Clustering ၏အသုံးဝင်မှုများအကြောင်းကိုအချိန်တစ်မိနစ်ယူပြီးစဉ်းစားပါ။ အမှန်တစ်ရားတွင် Clustering သည် သင်အဝတ်လျှော်ပုံတစ်ပုံကိုယူပြီး မိသားစုဝင်များ၏အဝတ်အစားများကိုစီစဉ်သောအခါဖြစ်ပေါ်သည် 🧦👕👖🩲။ Data science တွင် Clustering သည် user ၏စိတ်ကြိုက်များကိုခွဲခြားရန် သို့မဟုတ် unlabeled dataset တစ်ခု၏လက္ခဏာများကိုသတ်မှတ်ရန်အခါဖြစ်ပေါ်သည်။ Clustering သည် chaos ကိုအဓိပ္ပါယ်ရှိစေရာအတွက် အကူအညီပေးသည်၊ ဥပမာ - sock drawer တစ်ခုလိုပါပဲ။
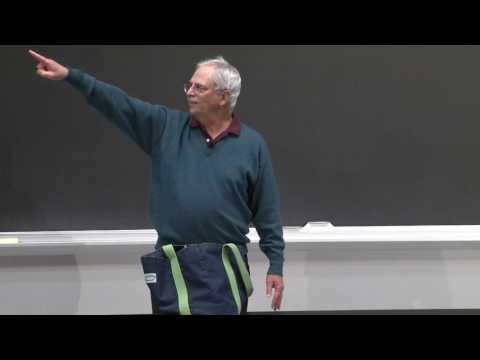
🎥 အထက်ပါပုံကိုနှိပ်ပြီး video ကိုကြည့်ပါ။ MIT ၏ John Guttag မှ Clustering ကိုမိတ်ဆက်သည်။
အလုပ်အကိုင် setting တွင် Clustering ကို market segmentation သတ်မှတ်ရန်၊ ဥပမာ - ဘယ်အသက်အရွယ်အုပ်စုများက ဘယ်ပစ္စည်းများကိုဝယ်လဲဆိုတာသတ်မှတ်ရန် အသုံးပြုနိုင်သည်။ အခြားအသုံးပြုမှုတစ်ခုကတော့ anomaly detection ဖြစ်ပြီး၊ ဥပမာ - credit card transaction dataset မှ fraud ကိုဖော်ထုတ်ရန်ဖြစ်သည်။ သို့မဟုတ် medical scan များအစုအပေါ်တွင် tumor များကိုသတ်မှတ်ရန် Clustering ကိုအသုံးပြုနိုင်သည်။
✅ Banking, e-commerce, သို့မဟုတ် business setting တစ်ခုတွင် Clustering ကို 'in the wild' တွေ့ရှိဖူးလားဆိုတာကိုအချိန်တစ်မိနစ်ယူပြီးစဉ်းစားပါ။
🎓 စိတ်ဝင်စားဖွယ်ကောင်းသည်မှာ၊ Cluster analysis သည် 1930 ခုနှစ်များတွင် Anthropology နှင့် Psychology ကဏ္ဍများတွင်မူလစတင်ခဲ့သည်။ အဲဒီအချိန်မှာဘယ်လိုအသုံးပြုခဲ့မလဲဆိုတာကိုစဉ်းစားနိုင်မလား?
အခြားနည်းလမ်းတစ်ခုကတော့ search result များကို grouping လုပ်ရန်ဖြစ်သည် - shopping link များ၊ image များ သို့မဟုတ် review များဖြင့် grouping လုပ်ခြင်း။ Clustering သည် dataset ကြီးတစ်ခုကိုလျှော့ချပြီး၊ granular analysis ပိုမိုလုပ်ဆောင်လိုသောအခါ အသုံးဝင်သည်။ ထို့ကြောင့်၊ အခြား model များကိုတည်ဆောက်မီ data အကြောင်းကိုလေ့လာရန်အတွက် technique တစ်ခုအဖြစ်အသုံးပြုနိုင်သည်။
✅ Data ကို cluster များအတွင်းစီစဉ်ပြီးနောက်၊ Cluster Id တစ်ခုကိုပေးအပ်ပြီး၊ dataset privacy ကိုထိန်းသိမ်းရန်အတွက် technique တစ်ခုအဖြစ်အသုံးဝင်သည်။ Data point ကိုပိုမိုဖော်ထုတ်နိုင်သော identifiable data များမဟုတ်ဘဲ Cluster Id ဖြင့်ရည်ညွှန်းနိုင်သည်။ Cluster Id ကိုအသုံးပြုရန်အခြားအကြောင်းရင်းများကိုစဉ်းစားနိုင်မလား?
Clustering technique များအကြောင်းကို Learn module တွင်ပိုမိုနက်နက်ရှိုင်းရှိုင်းလေ့လာပါ။
Clustering ကိုစတင်အသုံးပြုခြင်း
Scikit-learn မှာ Clustering ကိုလုပ်ဆောင်ရန်အတွက် နည်းလမ်းများစွာရှိသည်။ သင်ရွေးချယ်မည့်အမျိုးအစားသည် သင့် use case အပေါ်မူတည်သည်။ Documentation အရ၊ နည်းလမ်းတစ်ခုစီမှာ အမျိုးမျိုးသောအကျိုးကျေးဇူးများရှိသည်။ Scikit-learn မှ support ပြုသောနည်းလမ်းများနှင့်၎င်းတို့၏သင့်လျော်သော use case များကိုရိုးရှင်းသောဇယားအဖြစ်ဖော်ပြထားသည်။
| နည်းလမ်းအမည် | Use case |
|---|---|
| K-Means | general purpose, inductive |
| Affinity propagation | many, uneven clusters, inductive |
| Mean-shift | many, uneven clusters, inductive |
| Spectral clustering | few, even clusters, transductive |
| Ward hierarchical clustering | many, constrained clusters, transductive |
| Agglomerative clustering | many, constrained, non Euclidean distances, transductive |
| DBSCAN | non-flat geometry, uneven clusters, transductive |
| OPTICS | non-flat geometry, uneven clusters with variable density, transductive |
| Gaussian mixtures | flat geometry, inductive |
| BIRCH | large dataset with outliers, inductive |
🎓 Cluster များကိုဖန်တီးပုံသည် data point များကိုအုပ်စုများအတွင်းစုစည်းပုံနှင့်အလွန်ဆက်စပ်နေသည်။ Vocabulary အချို့ကိုရှင်းလင်းကြည့်ရအောင်:
🎓 'Transductive' vs. 'inductive'
Transductive inference သည် observed training case များမှတစ်ဆင့် specific test case များကို map လုပ်ခြင်းဖြစ်သည်။ Inductive inference သည် training case များမှတစ်ဆင့် general rule များကို map လုပ်ပြီး၊ test case များတွင်သာအသုံးပြုခြင်းဖြစ်သည်။
ဥပမာ - သင့် dataset တွင် label တစ်စိတ်တစ်ပိုင်းသာပါရှိသည်။ အချို့သည် 'records'၊ အချို့သည် 'cds'၊ အချို့သည် blank ဖြစ်သည်။ Blank များအတွက် label များပေးရန်သင့်တာဝန်ဖြစ်သည်။ Inductive approach ကိုရွေးချယ်ပါက၊ 'records' နှင့် 'cds' ကိုရှာဖွေသော model တစ်ခုကို train လုပ်ပြီး၊ unlabeled data တွင် label များကိုအသုံးပြုမည်။ ဤနည်းလမ်းသည် 'cassettes' ဖြစ်သောအရာများကို classify လုပ်ရန်အခက်အခဲရှိမည်။ Transductive approach သည် unknown data ကိုပိုမိုထိရောက်စွာကိုင်တွယ်နိုင်သည်၊ အရာများကိုအုပ်စုများအတွင်းစုစည်းပြီး၊ အုပ်စုတစ်ခုကို label ပေးသည်။ ဤကိစ္စတွင် cluster များသည် 'round musical things' နှင့် 'square musical things' ကိုဖော်ပြနိုင်သည်။
🎓 'Non-flat' vs. 'flat' geometry
Mathematical terminology မှရရှိသော၊ non-flat vs. flat geometry သည် point များအကြားအကွာအဝေးကို 'flat' (Euclidean) သို့မဟုတ် 'non-flat' (non-Euclidean) geometrical နည်းလမ်းများဖြင့်တိုင်းတာခြင်းကိုရည်ညွှန်းသည်။
'Flat' သည် Euclidean geometry ကိုရည်ညွှန်းပြီး၊ 'non-flat' သည် non-Euclidean geometry ကိုရည်ညွှန်းသည်။ Geometry သည် machine learning နှင့်ဘာကြောင့်ဆက်စပ်နေရသလဲ? Mathematics အပေါ်အခြေခံထားသောနယ်ပယ်နှစ်ခုအဖြစ်၊ cluster များအတွင်း point များအကြားအကွာအဝေးကိုတိုင်းတာရန်နည်းလမ်းတစ်ခုရှိရမည်။ Euclidean distances သည် point နှစ်ခုအကြား line segment ၏အရှည်ကိုတိုင်းတာခြင်းဖြစ်သည်။ Non-Euclidean distances သည် curve အတိုင်းတာခြင်းဖြစ်သည်။ သင့် data ကို visualization လုပ်ပါက၊ plane ပေါ်တွင်မရှိသည့်အခါ၊ specialized algorithm တစ်ခုကိုအသုံးပြုရန်လိုအပ်နိုင်သည်။
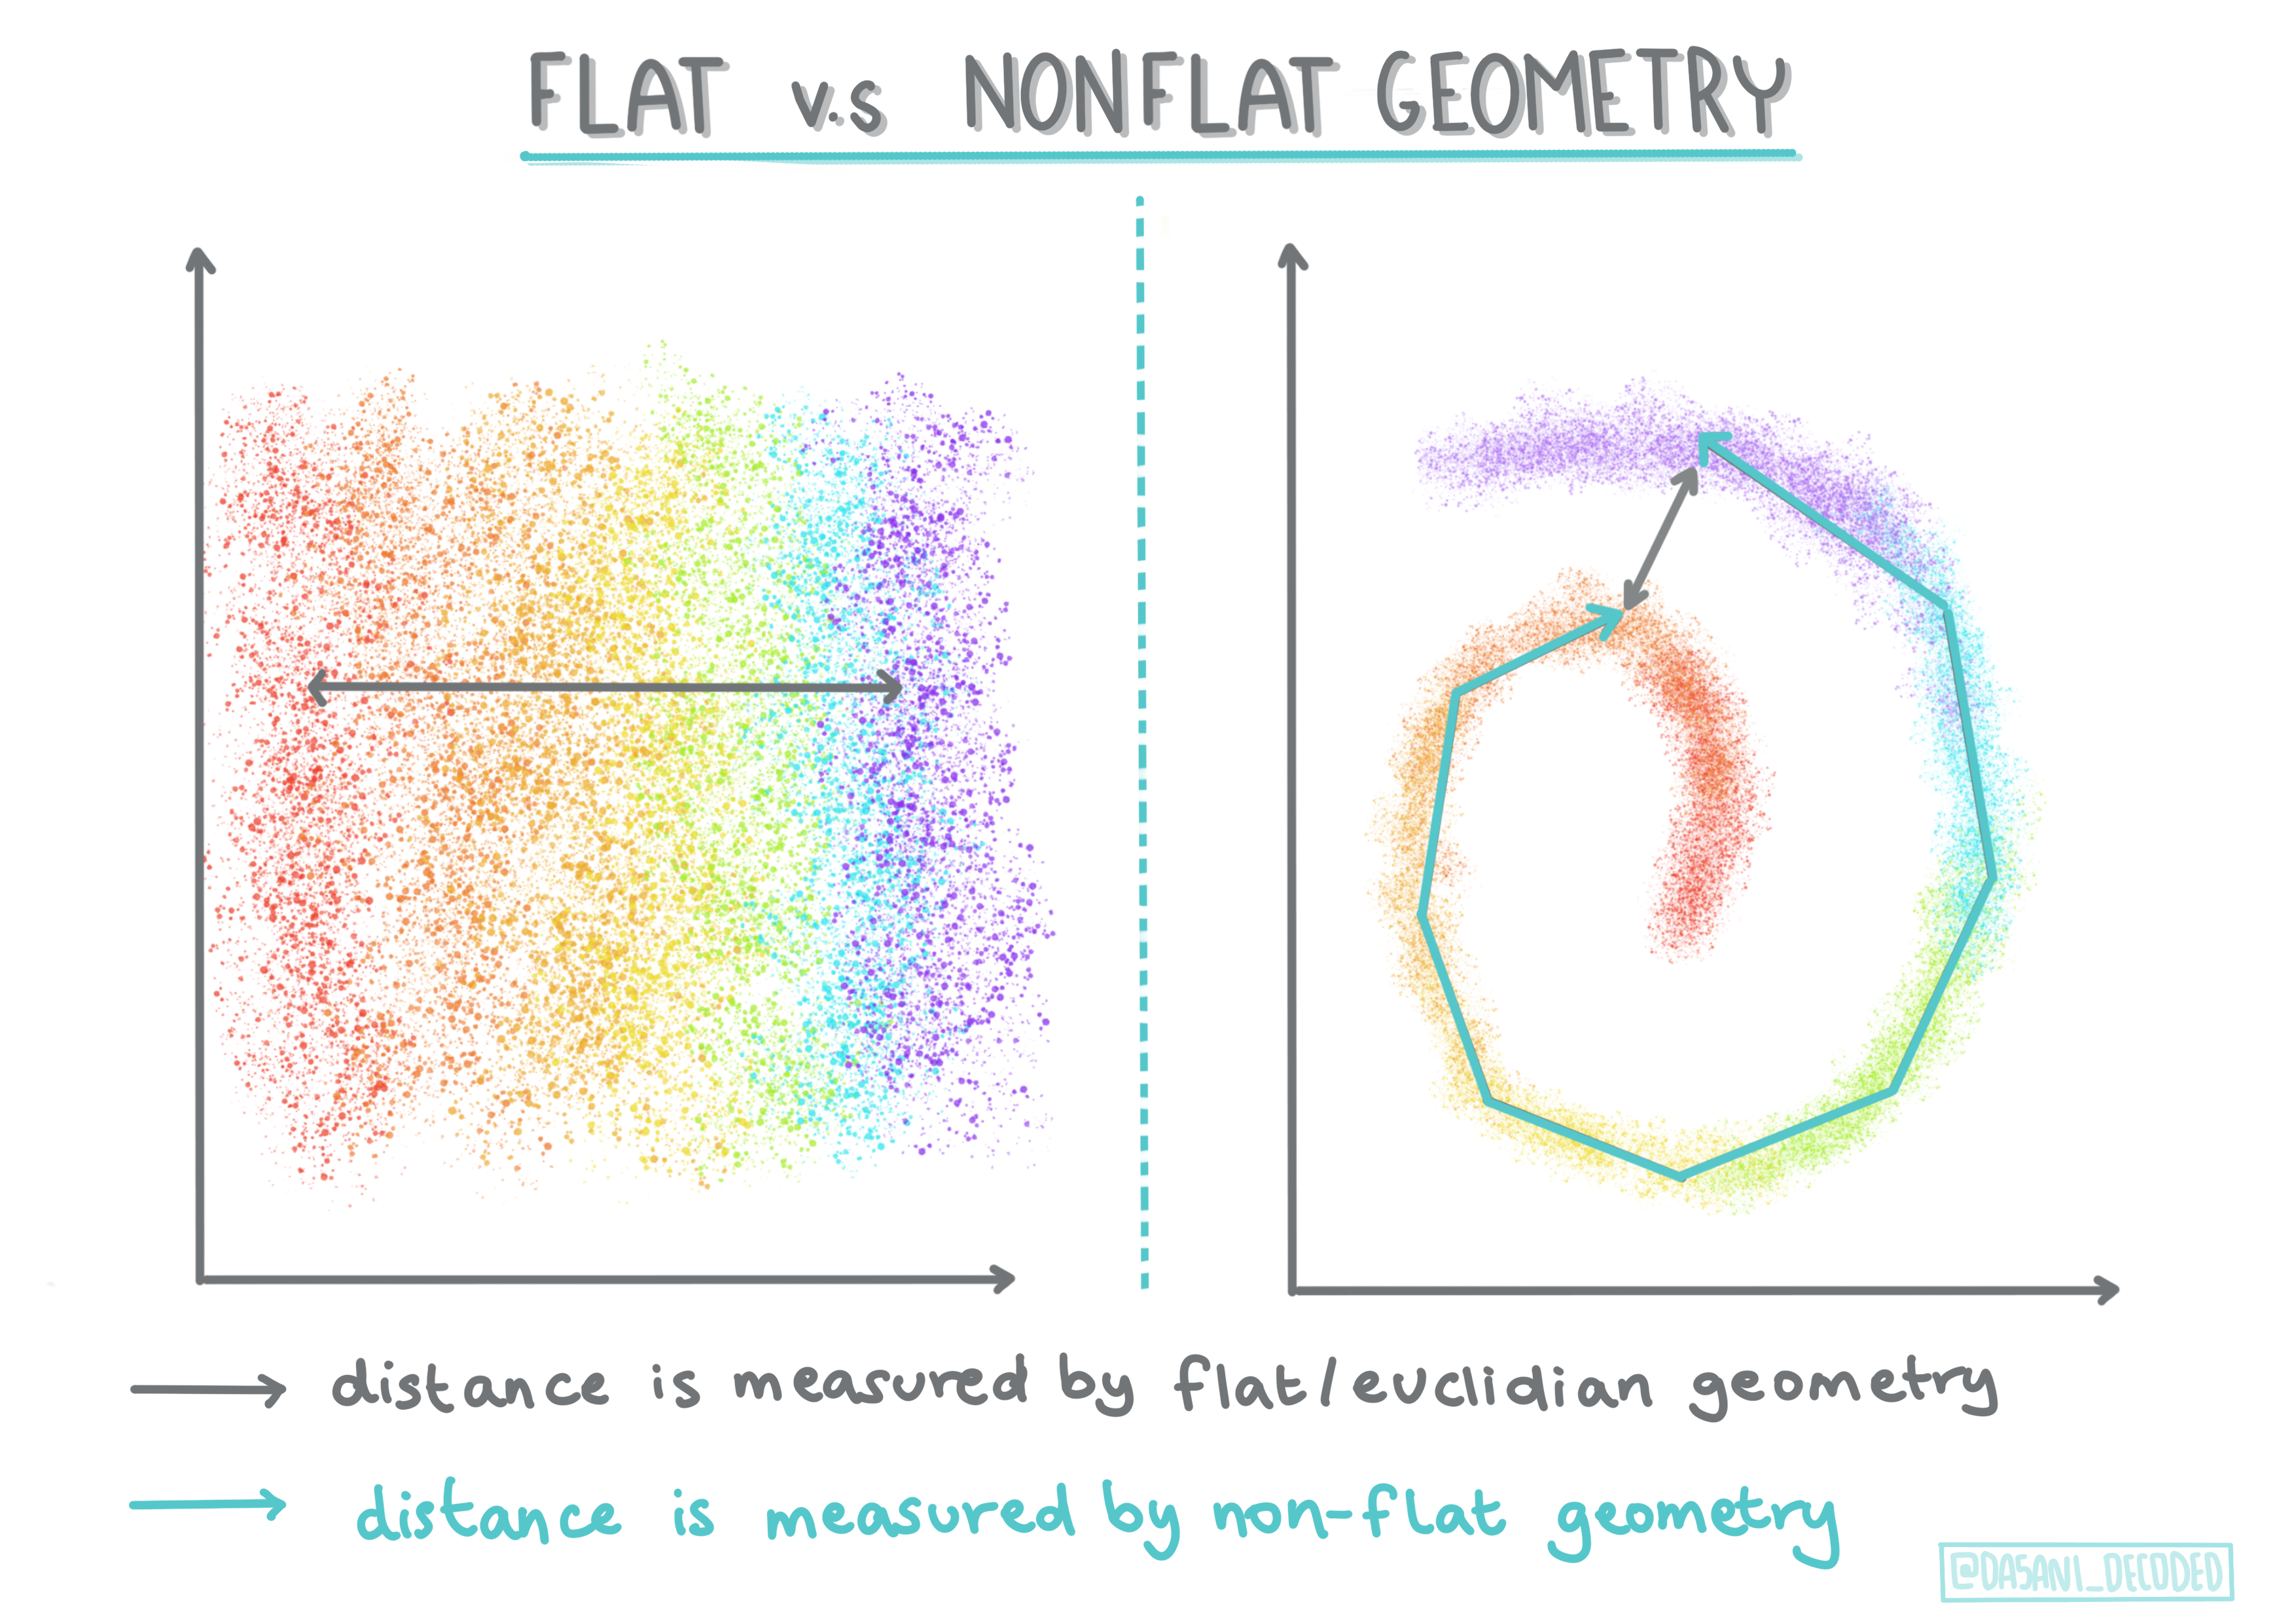
Infographic by Dasani Madipalli
Cluster များကို၎င်းတို့၏ distance matrix ဖြင့်သတ်မှတ်သည်၊ ဥပမာ - point များအကြားအကွာအဝေးများ။ ဤအကွာအဝေးကိုအနည်းငယ်နည်းလမ်းများဖြင့်တိုင်းတာနိုင်သည်။ Euclidean cluster များကို point value များ၏ပျမ်းမျှတန်ဖိုးဖြင့်သတ်မှတ်ပြီး၊ 'centroid' သို့မဟုတ် center point ပါရှိသည်။ အကွာအဝေးများကို၎င်း centroid အထိအကွာအဝေးဖြင့်တိုင်းတာသည်။ Non-Euclidean distance များသည် 'clustroid' များကိုရည်ညွှန်းသည်၊ အခြား point များနှင့်အနီးဆုံး point ဖြစ်သည်။ Clustroid များကိုအမျိုးမျိုးသောနည်းလမ်းများဖြင့်သတ်မှတ်နိုင်သည်။
Constrained Clustering သည် unsupervised method တွင် 'semi-supervised' learning ကိုမိတ်ဆက်သည်။ Point များအကြားဆက်နွယ်မှုများကို 'cannot link' သို့မဟုတ် 'must-link' အဖြစ် flag လုပ်ပြီး၊ dataset အပေါ် rule များကိုအတင်းအဓမ္မသတ်မှတ်သည်။
ဥပမာ - Algorithm တစ်ခုကို unlabeled သို့မဟုတ် semi-labelled data အပေါ်တွင်လွတ်လပ်စွာအသုံးပြုပါက၊ ဖန်တီးသော cluster များသည်အရည်အသွေးမကောင်းနိုင်သည်။ အထက်ပါဥပမာတွင် cluster များသည် 'round music things' နှင့် 'square music things' နှင့် 'triangular things' နှင့် 'cookies' ကို grouping လုပ်နိုင်သည်။ Constraint များ သို့မဟုတ် rule များ ("item သည် plastic ဖြင့်ပြုလုပ်ထားရမည်"၊ "item သည် music ထုတ်လုပ်နိုင်ရမည်") ပေးခြင်းဖြင့် algorithm ကိုပိုမိုကောင်းမွန်သောရွေးချယ်မှုများလုပ်ဆောင်ရန်အကူအညီပေးနိုင်သည်။
🎓 'Density'
'Noisy' data သည် 'dense' ဟုခေါ်သည်။ Cluster တစ်ခုစီတွင် point များအကြားအကွာအဝေးများသည် ပိုမိုသိပ်သည့် သို့မဟုတ် 'crowded' ဖြစ်နိုင်ပြီး၊ ဤ data ကိုသင့် data nature အပေါ်မူတည်၍ clustering method သင့်လျော်သောနည်းလမ်းဖြင့် analysis လုပ်ရန်လိုအပ်သည်။ ဤဆောင်းပါး သည် noisy dataset တစ်ခုကို uneven cluster density ဖြင့် K-Means clustering နှင့် HDBSCAN algorithm များကိုအသုံးပြု၍ explore လုပ်ခြင်း၏ကွာခြားချက်ကိုဖော်ပြသည်။
Clustering algorithm များ
Clustering algorithm များ 100 ကျော်ရှိပြီး၊ ၎င်းတို့၏အသုံးပြုမှုသည် data nature အပေါ်မူတည်သည်။ အဓိက algorithm များအချို့ကိုဆွေးနွေးကြည့်ရအောင်:
-
Hierarchical clustering. Object တစ်ခုကိုအနီးဆုံး object နှင့်အကွာအဝေးအပေါ်အခြေခံ၍ classify လုပ်ပါက၊ cluster များကို၎င်းတို့၏အဖွဲ့ဝင်များ၏အကွာအဝေးအပေါ်အခြေခံ၍ဖွဲ့စည်းသည်။ Scikit-learn ၏ agglomerative clustering သည် hierarchical ဖြစ်သည်။
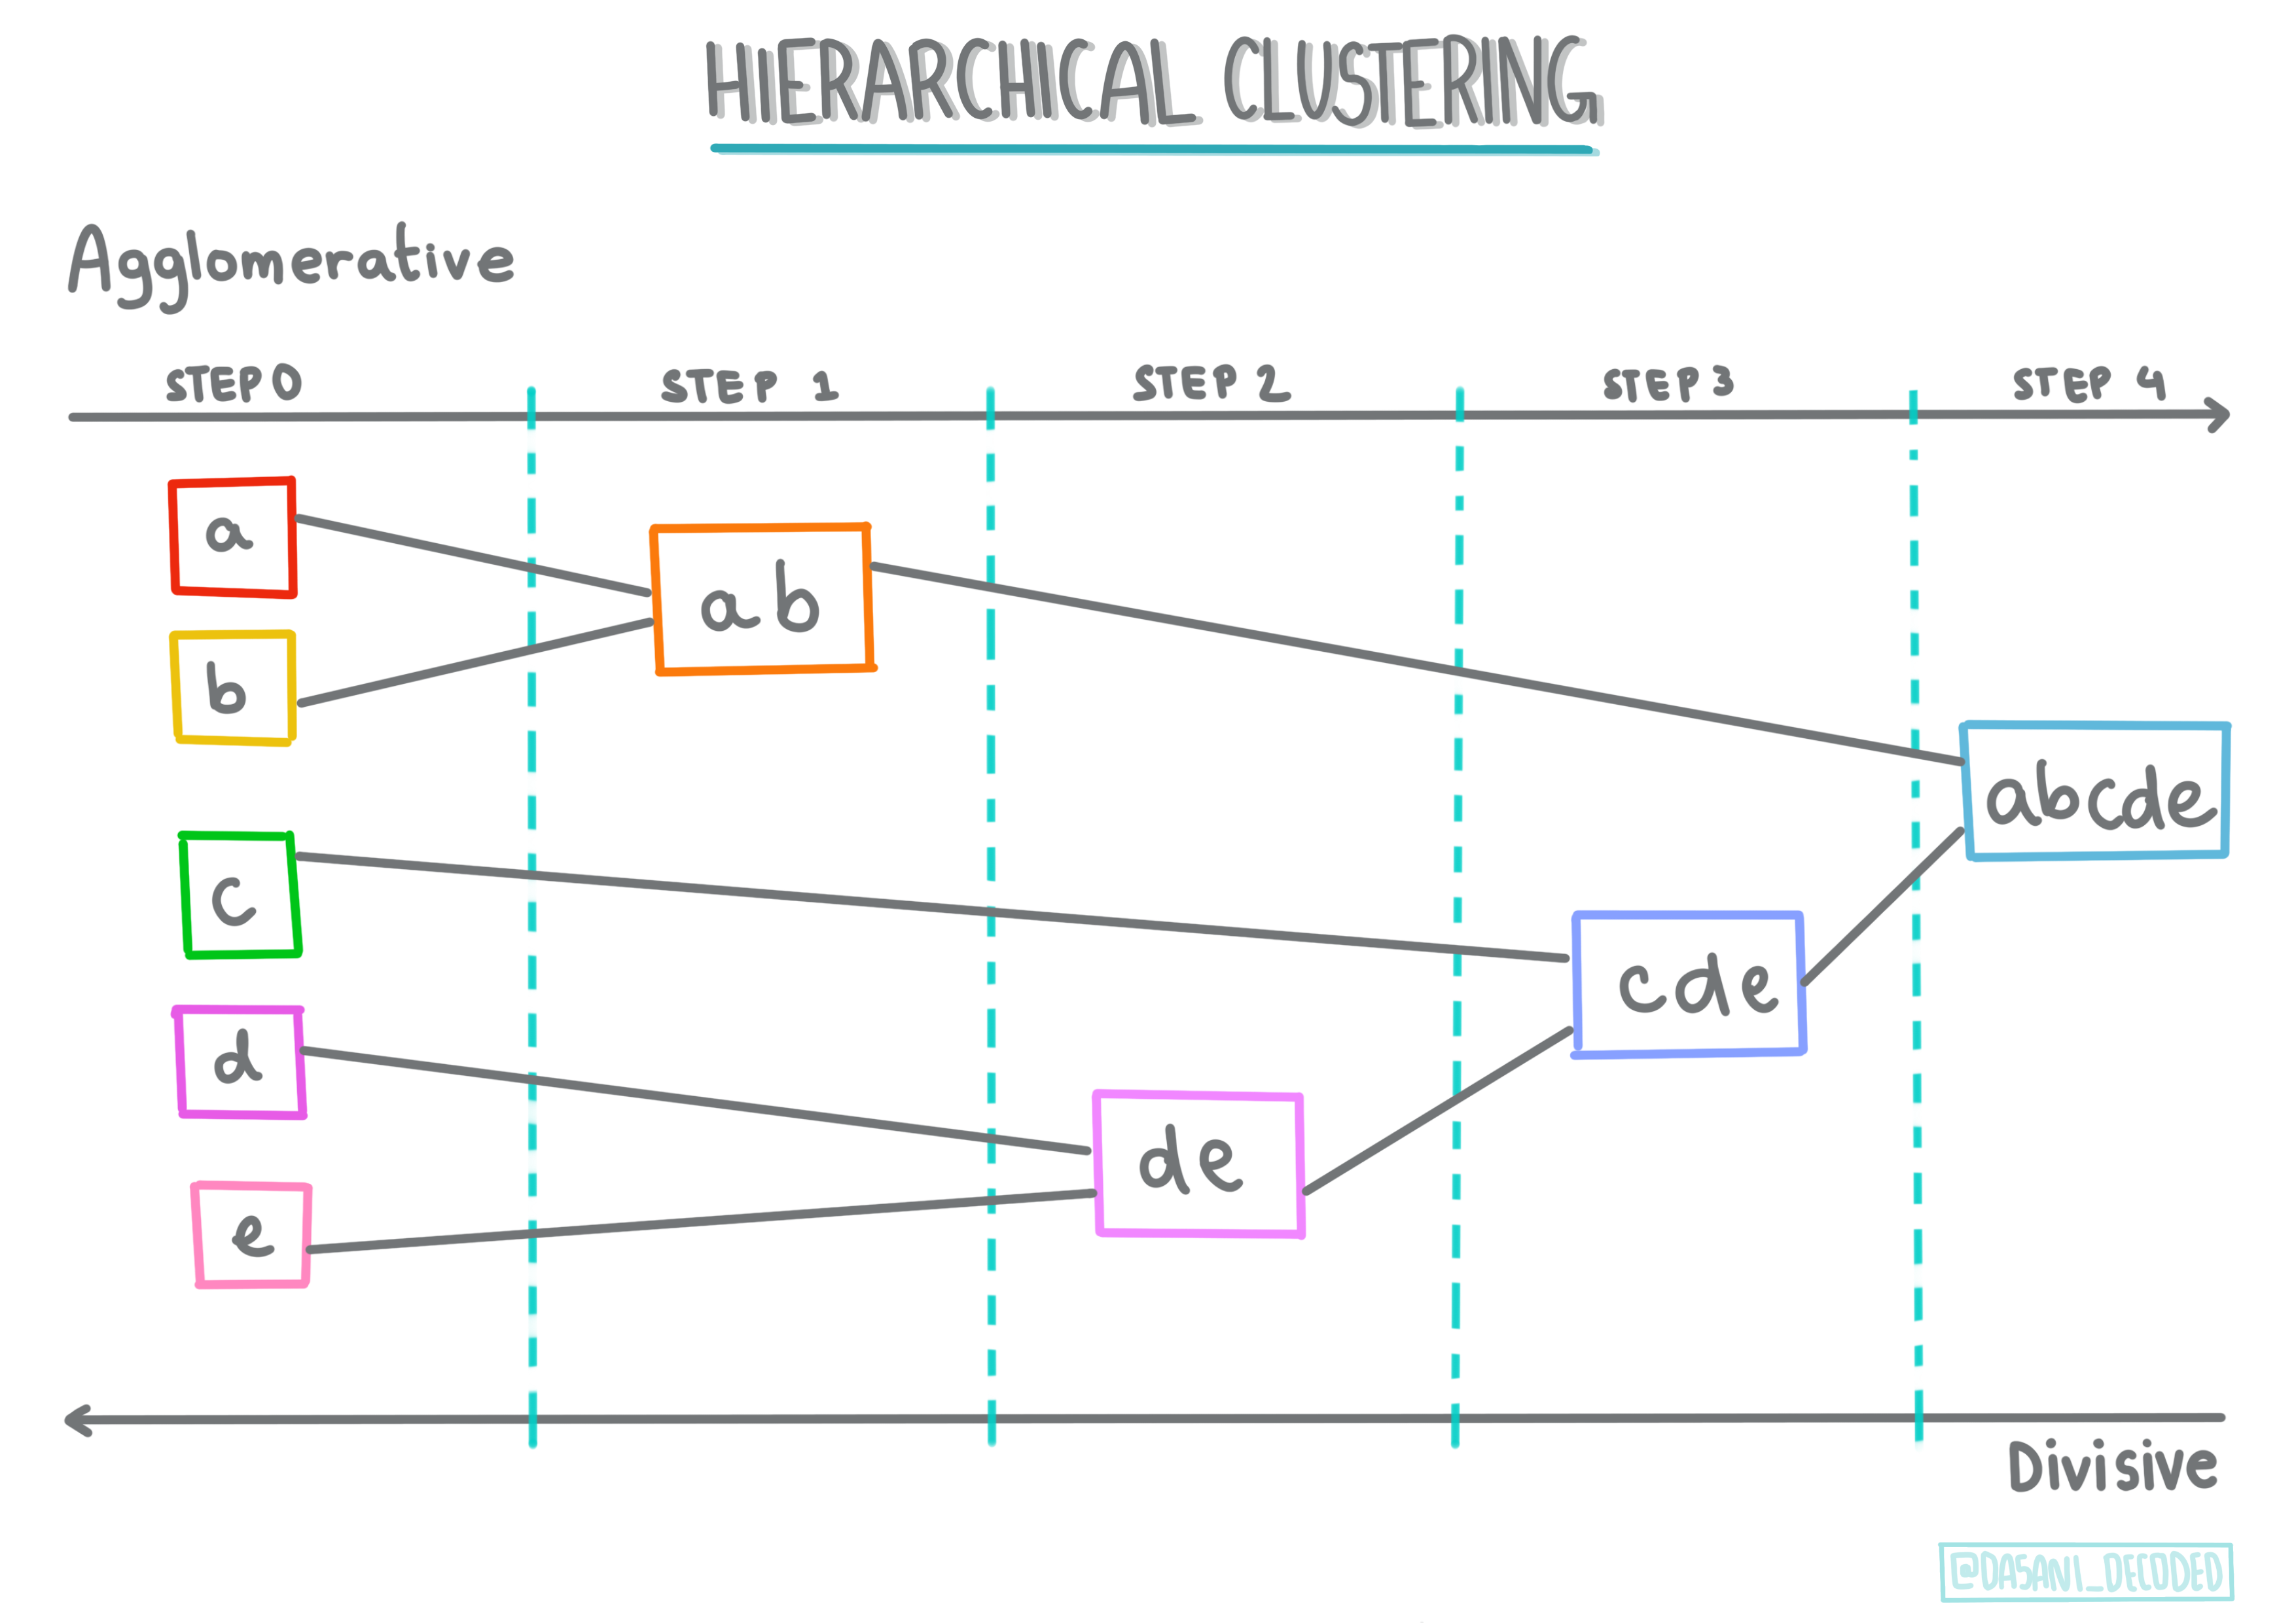
Infographic by Dasani Madipalli
-
Centroid clustering. ဤလူကြိုက်များ algorithm သည် 'k' သို့မဟုတ် ဖွဲ့စည်းရန် cluster အရေအတွက်ကိုရွေးချယ်ရန်လိုအပ်ပြီး၊ algorithm သည် cluster ၏ center point ကိုသတ်မှတ်ပြီး၊ data ကို၎င်း point အနီးတွင်စုစည်းသည်။ K-means clustering သည် centroid clustering ၏လူကြိုက်များသော version ဖြစ်သည်။ Center ကို nearest mean ဖြင့်သတ်မှတ်ပြီး၊ cluster မှ squared distance ကိုလျှော့ချသည်။
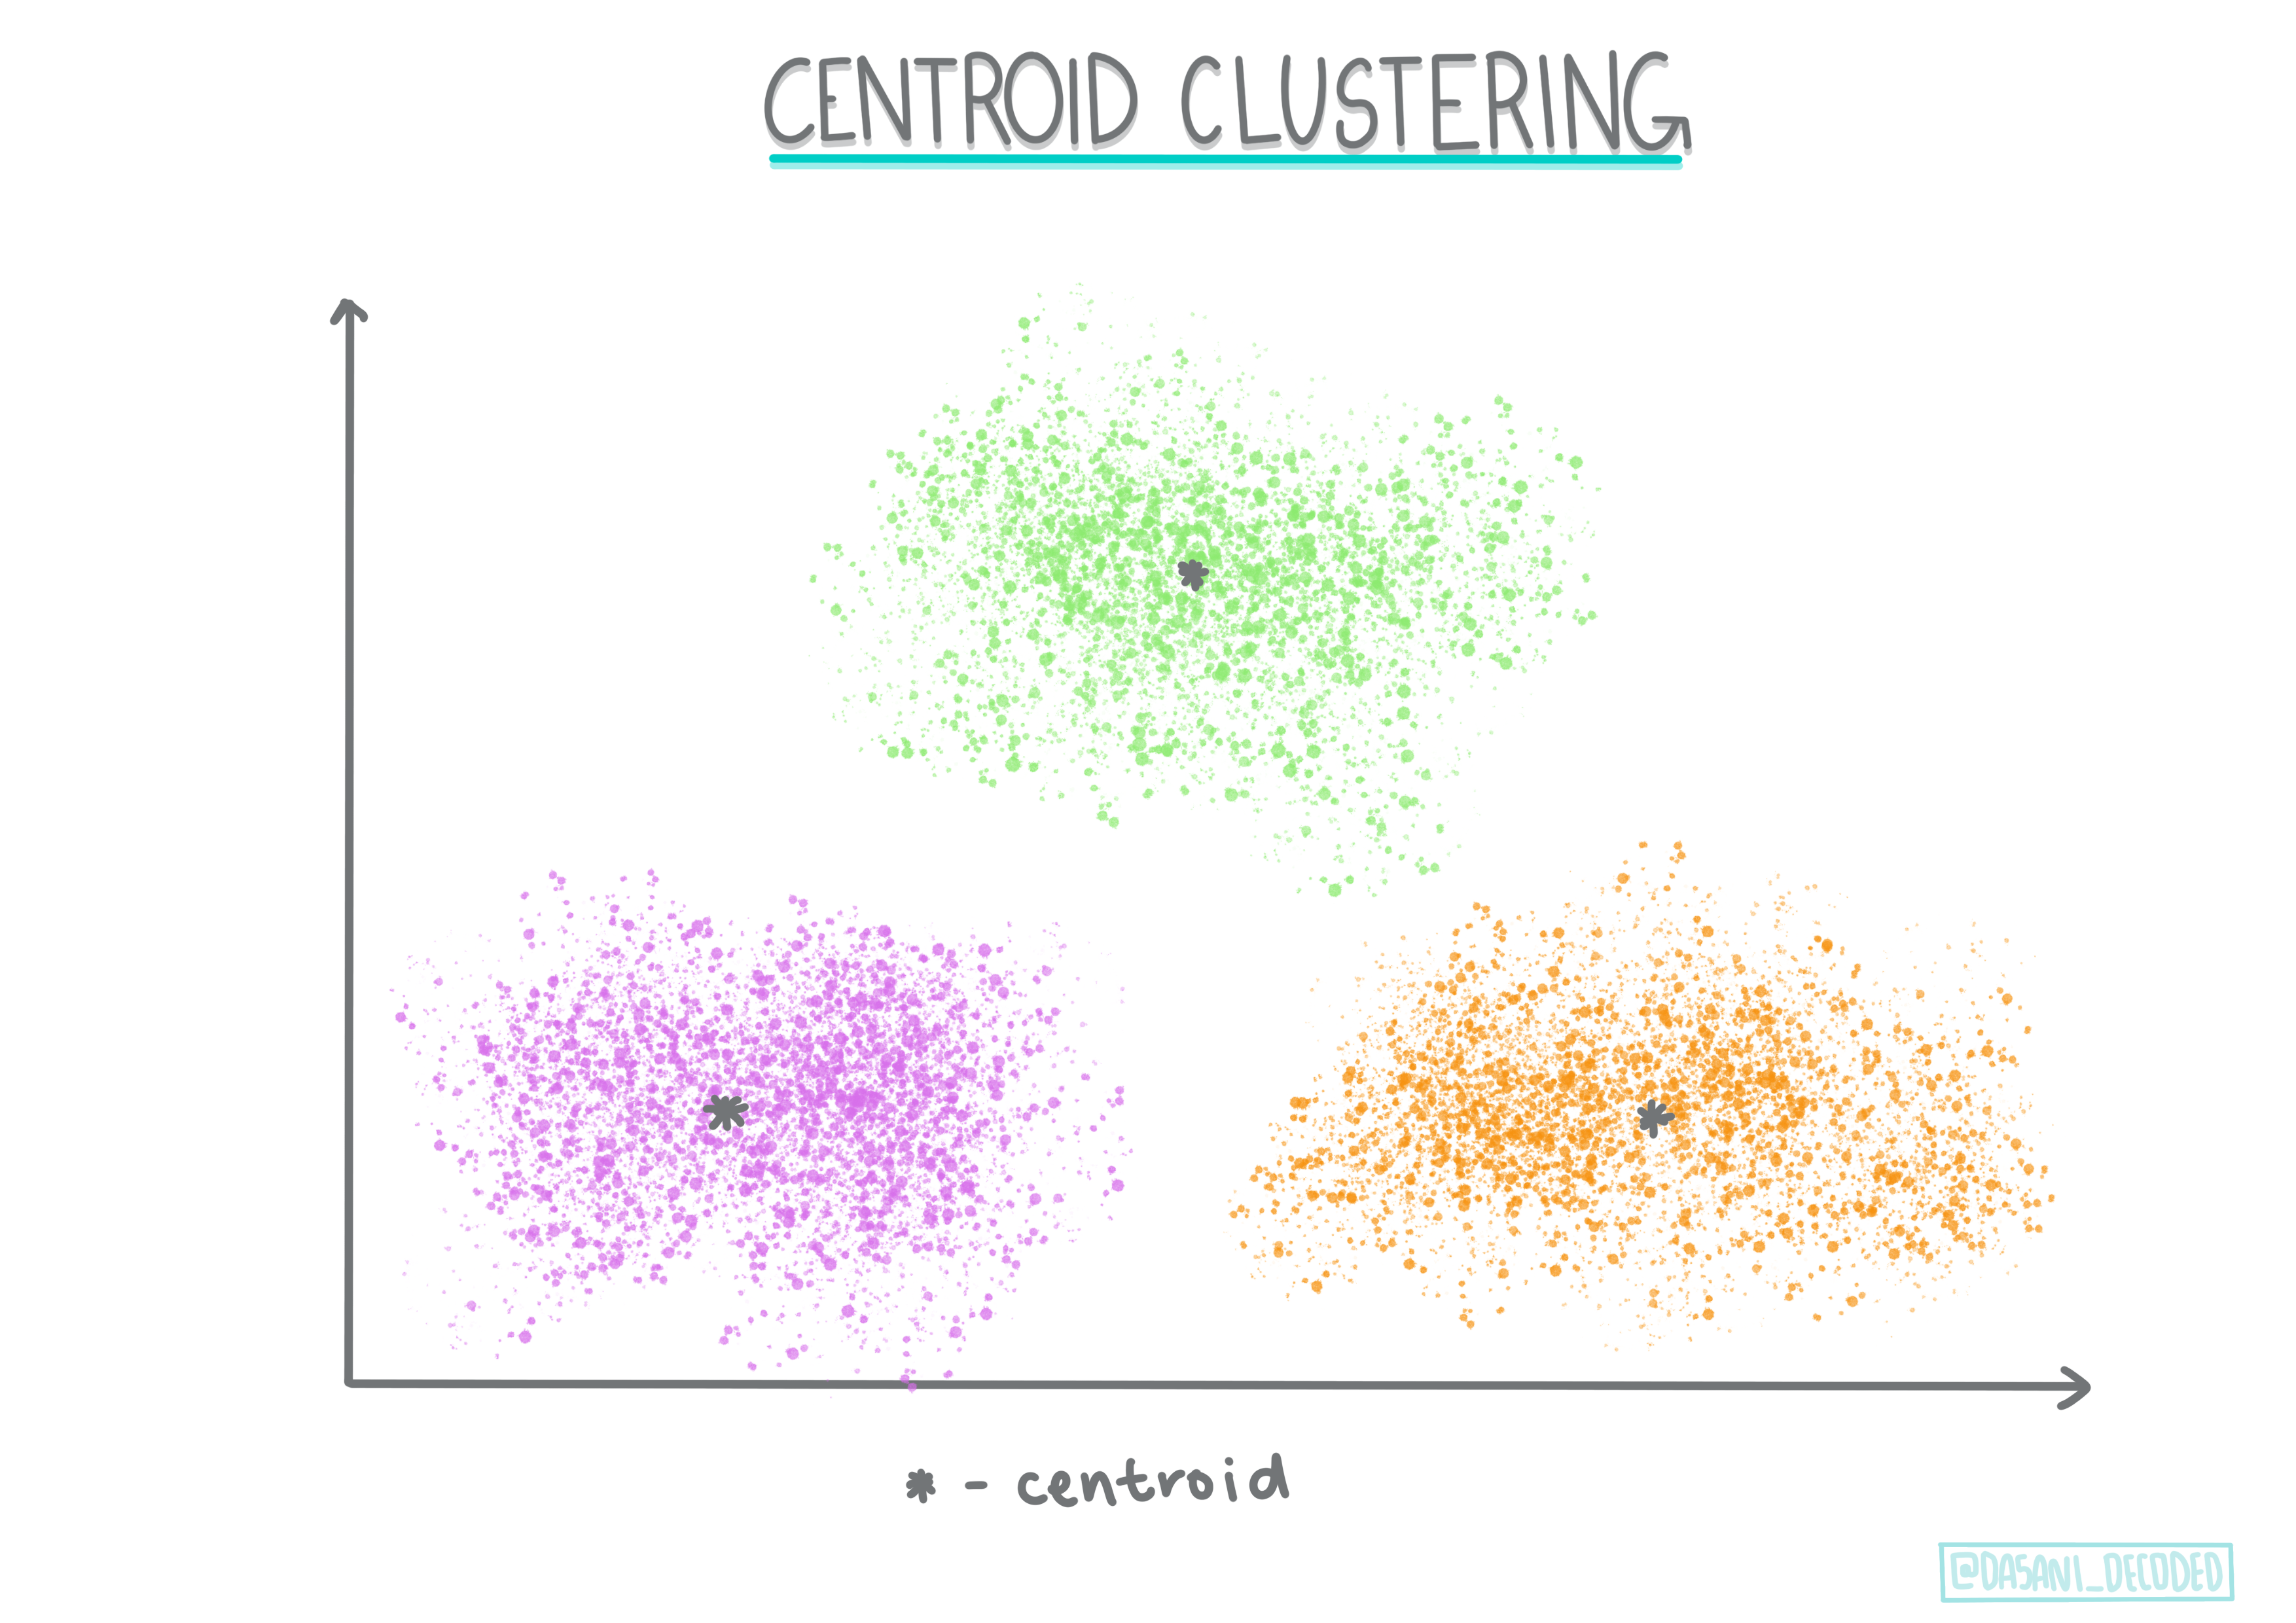
Infographic by Dasani Madipalli
-
Distribution-based clustering. Statistical modeling အပေါ်အခြေခံပြီး၊ distribution-based clustering သည် data point တစ်ခုသည် cluster တစ်ခုနှင့်ဆက်စပ်မှုရှိနိုင်သော probability ကိုသတ်မှတ်ပြီး၊ ၎င်းအတိုင်း assign လုပ်သည်။ Gaussian mixture method များသည်ဤအမျိုးအစားတွင်ပါဝင်သည်။
-
Density-based clustering. Data point များကို၎င်းတို့၏ density အပေါ်အခြေခံ၍ cluster များအတွင်း assign လုပ်သည်၊ ၎င်းတို့အုပ်စုအနီးတွင်စုစည်းခြင်းဖြစ်သည်။ အုပ်စုမှဝေးသော data point များကို outlier သို့မဟုတ် noise ဟုယူဆသည်။ DBSCAN, Mean-shift နှင့် OPTICS သည်ဤအမျိုးအစားတွင်ပါဝင်သည်။
-
Grid-based clustering. Multi-dimensional dataset များအတွက် grid တစ်ခုကိုဖန်တီးပြီး၊ data ကို grid ၏ cell များအတွင်းခွဲခြားခြင်းဖြင့် cluster များဖန်တီးသည်။
လေ့ကျင့်ခန်း - သင့် data ကို cluster လုပ်ပါ
Clustering သည် visualization မှတစ်ဆင့်အလွန်အကောင်းဆုံးအကူအညီရရှိသည်၊ ထို့ကြောင့် သင့် music data ကို visualize လုပ်ခြင်းဖြင့်စတင်ကြည့်ရအောင်။ ဤလေ့ကျင့်ခန်းသည် data nature အပေါ်အခြေခံ၍ clustering method မည်သို့အသုံးပြုရမည်ကိုဆုံးဖြတ်ရန်အကူအညီပေးမည်။
-
notebook.ipynb ဖိုင်ကို folder အတွင်းဖွင့်ပါ။
-
Data visualization ကောင်းစွာလုပ်ရန်
Seabornpackage ကို import လုပ်ပါ။!pip install seaborn -
nigerian-songs.csv မှ song | 2 | LITT! | LITT! | AYLØ | indie r&b | 2018 | 207758 | 40 | 0.836 | 0.272 | 0.564 | 0.000537 | 0.11 | -7.127 | 0.0424 | 130.005 | 4 | | 3 | Confident / Feeling Cool | Enjoy Your Life | Lady Donli | nigerian pop | 2019 | 175135 | 14 | 0.894 | 0.798 | 0.611 | 0.000187 | 0.0964 | -4.961 | 0.113 | 111.087 | 4 | | 4 | wanted you | rare. | Odunsi (The Engine) | afropop | 2018 | 152049 | 25 | 0.702 | 0.116 | 0.833 | 0.91 | 0.348 | -6.044 | 0.0447 | 105.115 | 4 |
-
Dataframe အကြောင်းကို သိရှိရန်
info()ကိုခေါ်ပါ:df.info()အထွေထွေ output က ဒီလိုပုံစံနဲ့ပါလိမ့်မယ်:
<class 'pandas.core.frame.DataFrame'> RangeIndex: 530 entries, 0 to 529 Data columns (total 16 columns): # Column Non-Null Count Dtype --- ------ -------------- ----- 0 name 530 non-null object 1 album 530 non-null object 2 artist 530 non-null object 3 artist_top_genre 530 non-null object 4 release_date 530 non-null int64 5 length 530 non-null int64 6 popularity 530 non-null int64 7 danceability 530 non-null float64 8 acousticness 530 non-null float64 9 energy 530 non-null float64 10 instrumentalness 530 non-null float64 11 liveness 530 non-null float64 12 loudness 530 non-null float64 13 speechiness 530 non-null float64 14 tempo 530 non-null float64 15 time_signature 530 non-null int64 dtypes: float64(8), int64(4), object(4) memory usage: 66.4+ KB -
Null values ရှိမရှိ double-check လုပ်ပါ၊
isnull()ကိုခေါ်ပြီး sum ကို 0 ဖြစ်ကြောင်းအတည်ပြုပါ:df.isnull().sum()အဆင်ပြေပါတယ်:
name 0 album 0 artist 0 artist_top_genre 0 release_date 0 length 0 popularity 0 danceability 0 acousticness 0 energy 0 instrumentalness 0 liveness 0 loudness 0 speechiness 0 tempo 0 time_signature 0 dtype: int64 -
Data ကို ဖော်ပြပါ:
df.describe()release_date length popularity danceability acousticness energy instrumentalness liveness loudness speechiness tempo time_signature count 530 530 530 530 530 530 530 530 530 530 530 530 mean 2015.390566 222298.1698 17.507547 0.741619 0.265412 0.760623 0.016305 0.147308 -4.953011 0.130748 116.487864 3.986792 std 3.131688 39696.82226 18.992212 0.117522 0.208342 0.148533 0.090321 0.123588 2.464186 0.092939 23.518601 0.333701 min 1998 89488 0 0.255 0.000665 0.111 0 0.0283 -19.362 0.0278 61.695 3 25% 2014 199305 0 0.681 0.089525 0.669 0 0.07565 -6.29875 0.0591 102.96125 4 50% 2016 218509 13 0.761 0.2205 0.7845 0.000004 0.1035 -4.5585 0.09795 112.7145 4 75% 2017 242098.5 31 0.8295 0.403 0.87575 0.000234 0.164 -3.331 0.177 125.03925 4 max 2020 511738 73 0.966 0.954 0.995 0.91 0.811 0.582 0.514 206.007 5
🤔 Clustering သည် labeled data မလိုအပ်သော unsupervised method ဖြစ်သည့်အတွက် label data ကို ဖော်ပြနေခြင်းက ဘာကြောင့်လဲ? Data exploration အဆင့်တွင် အသုံးဝင်နိုင်သော်လည်း clustering algorithms အတွက် မလိုအပ်ပါ။ Column headers ကို ဖယ်ရှားပြီး column number ဖြင့် data ကို ရည်ညွှန်းနိုင်ပါတယ်။
Data ရဲ့ အထွေထွေတန်ဖိုးတွေကို ကြည့်ပါ။ Popularity က '0' ဖြစ်နိုင်ပြီး အဲဒါက songs တွေ ranking မရှိကြောင်းပြသပါတယ်။ အဲဒါတွေကို ခဏလေးမှာ ဖယ်ရှားလိုက်ပါမယ်။
-
Barplot ကို အသုံးပြုပြီး အများဆုံး popular genres တွေကို ရှာပါ:
import seaborn as sns

top = df['artist_top_genre'].value_counts()
plt.figure(figsize=(10,7))
sns.barplot(x=top[:5].index,y=top[:5].values)
plt.xticks(rotation=45)
plt.title('Top genres',color = 'blue')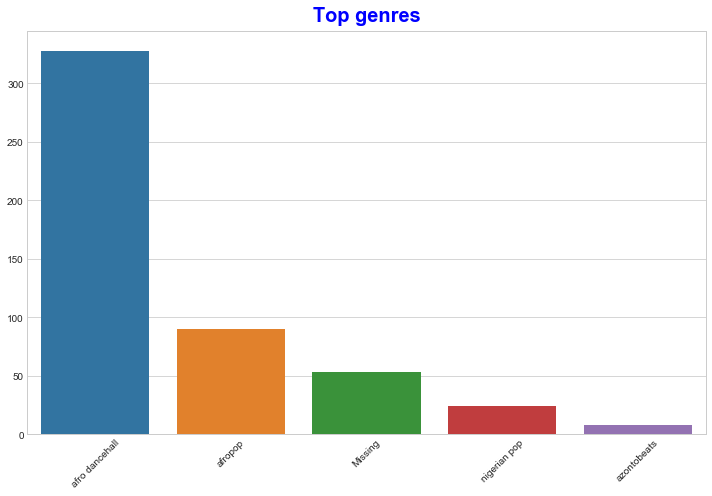
✅ Top values ပိုများစေချင်ရင် [:5] ကို value ပိုကြီးတဲ့အရာနဲ့ ပြောင်းပါ၊ ဒါမှမဟုတ် ဖယ်ရှားပြီး အားလုံးကို ကြည့်ပါ။
Note, top genre ကို 'Missing' လို့ ဖော်ပြထားရင် Spotify က အဲဒါကို classify မလုပ်တာဖြစ်ပါတယ်၊ ဒါကြောင့် ဖယ်ရှားလိုက်ပါ။
-
Missing data ကို ဖယ်ရှားပါ:
df = df[df['artist_top_genre'] != 'Missing']
top = df['artist_top_genre'].value_counts()
plt.figure(figsize=(10,7))
sns.barplot(x=top.index,y=top.values)
plt.xticks(rotation=45)
plt.title('Top genres',color = 'blue')
အခုတော့ genres တွေကို ပြန်စစ်ပါ:
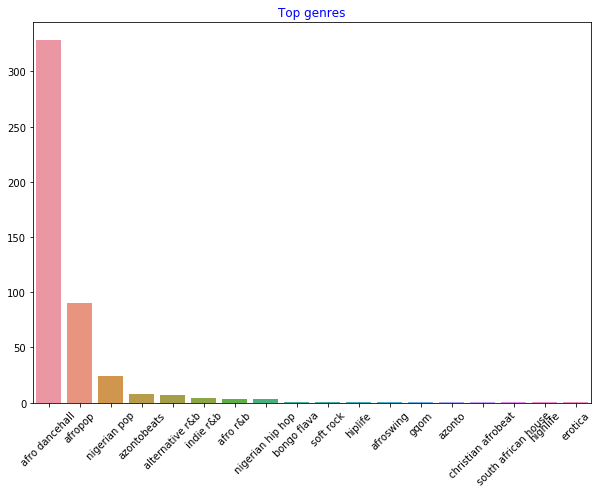
-
Top three genres တွေ dataset ကို အဓိကထားပြီး
afro dancehall,afropop,nigerian popတွေကို စုစည်းပါ၊ Popularity value 0 ဖြစ်တဲ့အရာတွေကို ဖယ်ရှားပါ (အဲဒါက dataset မှာ popularity classification မရှိတာဖြစ်ပြီး noise အဖြစ် သတ်မှတ်နိုင်ပါတယ်):df = df[(df['artist_top_genre'] == 'afro dancehall') | (df['artist_top_genre'] == 'afropop') | (df['artist_top_genre'] == 'nigerian pop')] df = df[(df['popularity'] > 0)] top = df['artist_top_genre'].value_counts() plt.figure(figsize=(10,7)) sns.barplot(x=top.index,y=top.values) plt.xticks(rotation=45) plt.title('Top genres',color = 'blue') -
Data တွေ correlation ရှိမရှိ စစ်ဆေးပါ:
corrmat = df.corr(numeric_only=True)
f, ax = plt.subplots(figsize=(12, 9))
sns.heatmap(corrmat, vmax=.8, square=True)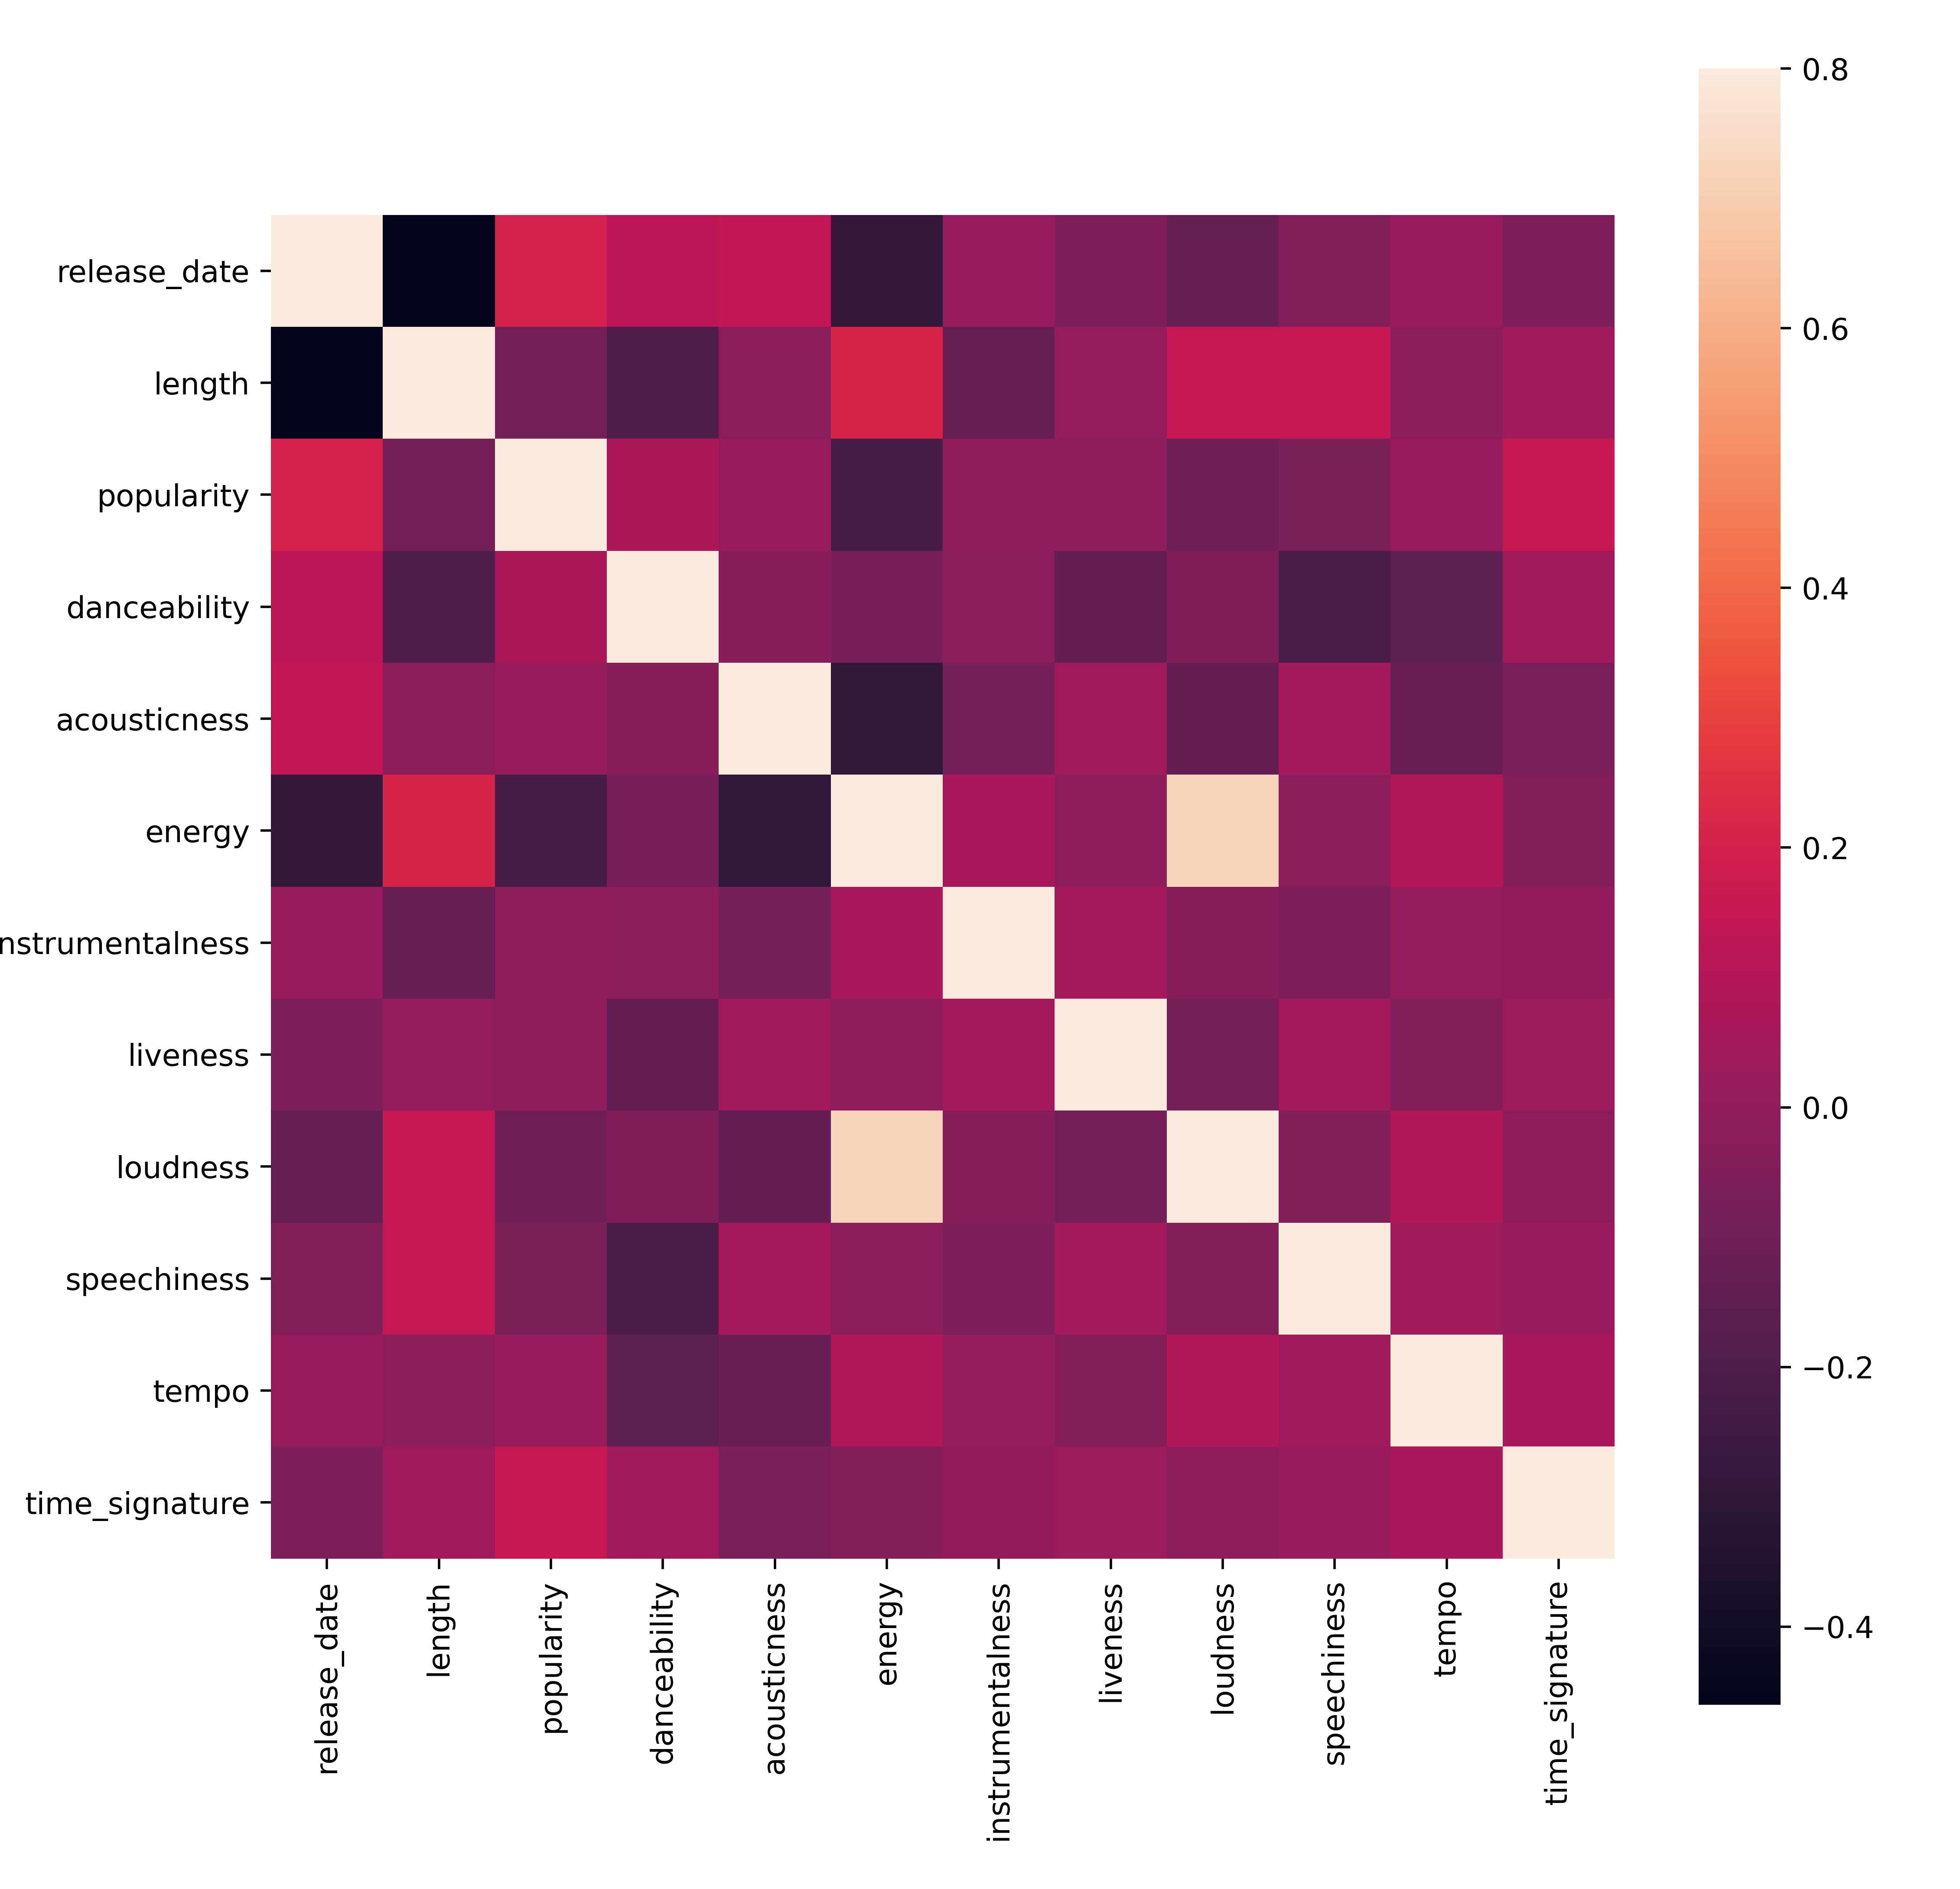
energyနဲ့loudnessအကြား correlation က အားကောင်းပါတယ်၊ ဒါက အံ့ဩစရာမဟုတ်ပါဘူး၊ အကြမ်း music တွေက အများအားဖြင့် energetic ဖြစ်တတ်ပါတယ်။ အခြား correlation တွေက အားနည်းပါတယ်။ Clustering algorithm က ဒီ data ကို ဘယ်လိုသုံးနိုင်မလဲ စိတ်ဝင်စားစရာပါ။🎓 Correlation က causation ကို မပြသနိုင်ပါ! Correlation ရှိကြောင်း သက်သေရှိသော်လည်း causation ရှိကြောင်း သက်သေမရှိပါ။ အလွဲလွဲ correlation တွေ ကို ဖော်ပြတဲ့ website က ဒီအချက်ကို အထောက်အထားပေးပါတယ်။
Dataset မှာ song popularity နဲ့ danceability အကြား convergence ရှိပါသလား? FacetGrid က genre မရွေး concentric circles တွေ alignment ရှိကြောင်း ပြသပါတယ်။ Nigerian tastes တွေ danceability ရဲ့ အတိအကျတန်းမှာ converge ဖြစ်နိုင်ပါသလား?
✅ အခြား datapoints (energy, loudness, speechiness) နဲ့ အခြား genres တွေကို စမ်းကြည့်ပါ။ ဘာတွေ ရှာဖွေနိုင်မလဲ? df.describe() table ကို ကြည့်ပြီး data points ရဲ့ general spread ကို သိပါ။
လေ့ကျင့်ခန်း - data distribution
Top three genres တွေ popularity နဲ့ danceability perception အတွက် significantly ကွဲပြားမှု ရှိပါသလား?
-
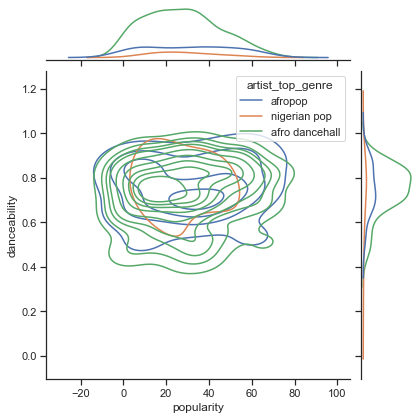
Top three genres data distribution ကို popularity နဲ့ danceability အတွက် x axis နဲ့ y axis အတူတူကြည့်ပါ:
sns.set_theme(style="ticks")

g = sns.jointplot(
    data=df,
    x="popularity", y="danceability", hue="artist_top_genre",
    kind="kde",
)
Concentric circles တွေ general point of convergence အနီးမှာ distribution ကို ပြသပါတယ်။
🎓 KDE (Kernel Density Estimate) graph ကို အသုံးပြုထားပြီး continuous probability density curve ဖြင့် data ကို ဖော်ပြထားပါတယ်။ ဒါက multiple distributions တွေကို အဓိကထားပြီး data ကို အဓိပ္ပါယ်ဖော်ပြနိုင်စေပါတယ်။
အထွေထွေအားဖြင့် genres သုံးခုက popularity နဲ့ danceability အတွက် loosely alignment ရှိပါတယ်။ Clustering algorithm အတွက် ဒီ alignment data ကို သတ်မှတ်ရမှာ စိန်ခေါ်မှုဖြစ်ပါမယ်:
-
Scatter plot တစ်ခု ဖန်တီးပါ:
sns.FacetGrid(df, hue="artist_top_genre", height=5) \
   .map(plt.scatter, "popularity", "danceability") \
   .add_legend()
အတူတူ axis တွေ scatterplot က convergence pattern ကို ပြသပါတယ်။
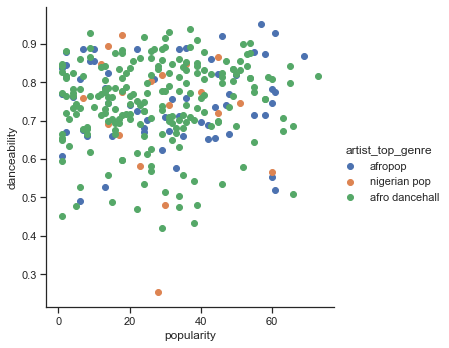
Clustering အတွက် scatterplots ကို အသုံးပြုပြီး data clusters တွေကို ဖော်ပြနိုင်ပါတယ်၊ ဒါကြောင့် visualization အမျိုးအစားကို ကျွမ်းကျင်စွာ အသုံးပြုနိုင်ဖို့ အရေးကြီးပါတယ်။ နောက် lesson မှာ filtered data ကို k-means clustering နဲ့ သုံးပြီး interesting overlap တွေကို ရှာဖွေပါမယ်။
🚀Challenge
နောက် lesson အတွက် ပြင်ဆင်ရန်၊ production environment မှာ အသုံးပြုနိုင်တဲ့ clustering algorithms အမျိုးမျိုးအကြောင်း chart တစ်ခု ဖန်တီးပါ။ Clustering က ဘယ်လိုပြဿနာတွေကို ဖြေရှင်းဖို့ ကြိုးစားနေလဲ?
Post-lecture quiz
Review & Self Study
Clustering algorithms ကို အသုံးပြုမီ dataset ရဲ့ nature ကို နားလည်ထားတာ အရေးကြီးပါတယ်။ ဒီအကြောင်းကို ဒီမှာ ဖတ်ရှုပါ။
ဒီ article က clustering algorithms အမျိုးမျိုးရဲ့ behavior ကို data shapes အမျိုးမျိုးနဲ့ ဖော်ပြထားပါတယ်။
Assignment
Clustering visualization အခြားအမျိုးအစားတွေကို ရှာဖွေပါ
ဝက်ဘ်ဆိုက်မှတ်ချက်:
ဤစာရွက်စာတမ်းကို AI ဘာသာပြန်ဝန်ဆောင်မှု Co-op Translator ကို အသုံးပြု၍ ဘာသာပြန်ထားပါသည်။ ကျွန်ုပ်တို့သည် တိကျမှန်ကန်မှုအတွက် ကြိုးစားနေပါသော်လည်း၊ အလိုအလျောက်ဘာသာပြန်မှုများတွင် အမှားများ သို့မဟုတ် မမှန်ကန်မှုများ ပါဝင်နိုင်သည်ကို ကျေးဇူးပြု၍ သတိပြုပါ။ မူရင်းစာရွက်စာတမ်းကို ၎င်း၏ မူလဘာသာစကားဖြင့် အာဏာတည်သောရင်းမြစ်အဖြစ် သတ်မှတ်ရန် လိုအပ်ပါသည်။ အရေးကြီးသော အချက်အလက်များအတွက် လူကောင်းမွန်သော ပရော်ဖက်ရှင်နယ်ဘာသာပြန်ဝန်ဆောင်မှုကို အကြံပြုပါသည်။ ဤဘာသာပြန်မှုကို အသုံးပြုခြင်းမှ ဖြစ်ပေါ်လာသော နားလည်မှုမှားများ သို့မဟုတ် အဓိပ္ပါယ်မှားများအတွက် ကျွန်ုပ်တို့သည် တာဝန်မယူပါ။