
 localizeflow[bot]
081f029c0d
localizeflow[bot]
081f029c0d
|
7 months ago | |
|---|---|---|
| .. | ||
| solution | 7 months ago | |
| README.md | 7 months ago | |
| assignment.md | 7 months ago | |
| notebook.ipynb | 9 months ago | |
README.md
K-Means clustering
Pre-lecture quiz
For dis lesson, you go learn how to create clusters wit Scikit-learn and di Nigerian music dataset wey you don import before. We go cover di basics of K-Means for Clustering. Remember say, as you don learn for di earlier lesson, plenty ways dey to work wit clusters and di method wey you go use depend on your data. We go try K-Means because na di most common clustering technique. Make we start!
Terms wey you go learn about:
- Silhouette scoring
- Elbow method
- Inertia
- Variance
Introduction
K-Means Clustering na method wey dem take from di signal processing domain. E dey used to divide and partition groups of data into 'k' clusters using series of observations. Each observation dey work to group one given datapoint close to di nearest 'mean', or di center point of one cluster.
Di clusters fit dey visualized as Voronoi diagrams, wey include one point (or 'seed') and di region wey dey follow am.
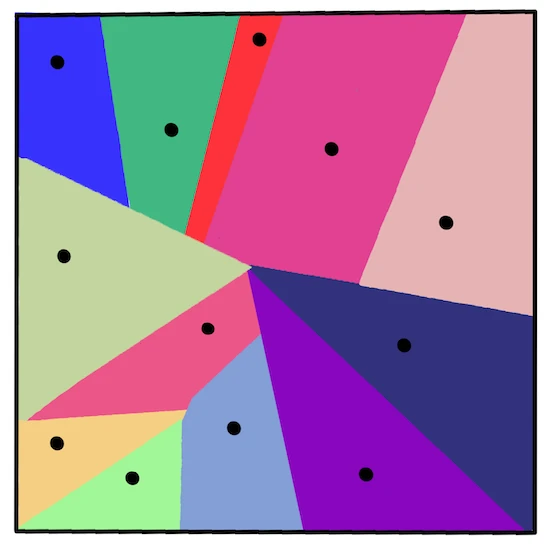
infographic by Jen Looper
Di K-Means clustering process dey work wit three-step process:
- Di algorithm go select k-number of center points by sampling from di dataset. After dis, e go dey loop:
- E go assign each sample to di nearest centroid.
- E go create new centroids by taking di mean value of all di samples wey dem assign to di previous centroids.
- Then, e go calculate di difference between di new and old centroids and repeat until di centroids don stabilize.
One wahala wey dey wit K-Means na say you go need to establish 'k', wey be di number of centroids. But di 'elbow method' dey help estimate one good starting value for 'k'. You go try am soon.
Prerequisite
You go work for dis lesson notebook.ipynb file wey get di data import and preliminary cleaning wey you do for di last lesson.
Exercise - preparation
Start by looking di songs data again.
-
Create one boxplot, call
boxplot()for each column:plt.figure(figsize=(20,20), dpi=200) plt.subplot(4,3,1) sns.boxplot(x = 'popularity', data = df) plt.subplot(4,3,2) sns.boxplot(x = 'acousticness', data = df) plt.subplot(4,3,3) sns.boxplot(x = 'energy', data = df) plt.subplot(4,3,4) sns.boxplot(x = 'instrumentalness', data = df) plt.subplot(4,3,5) sns.boxplot(x = 'liveness', data = df) plt.subplot(4,3,6) sns.boxplot(x = 'loudness', data = df) plt.subplot(4,3,7) sns.boxplot(x = 'speechiness', data = df) plt.subplot(4,3,8) sns.boxplot(x = 'tempo', data = df) plt.subplot(4,3,9) sns.boxplot(x = 'time_signature', data = df) plt.subplot(4,3,10) sns.boxplot(x = 'danceability', data = df) plt.subplot(4,3,11) sns.boxplot(x = 'length', data = df) plt.subplot(4,3,12) sns.boxplot(x = 'release_date', data = df)Dis data dey small noisy: if you observe each column as boxplot, you go see outliers.
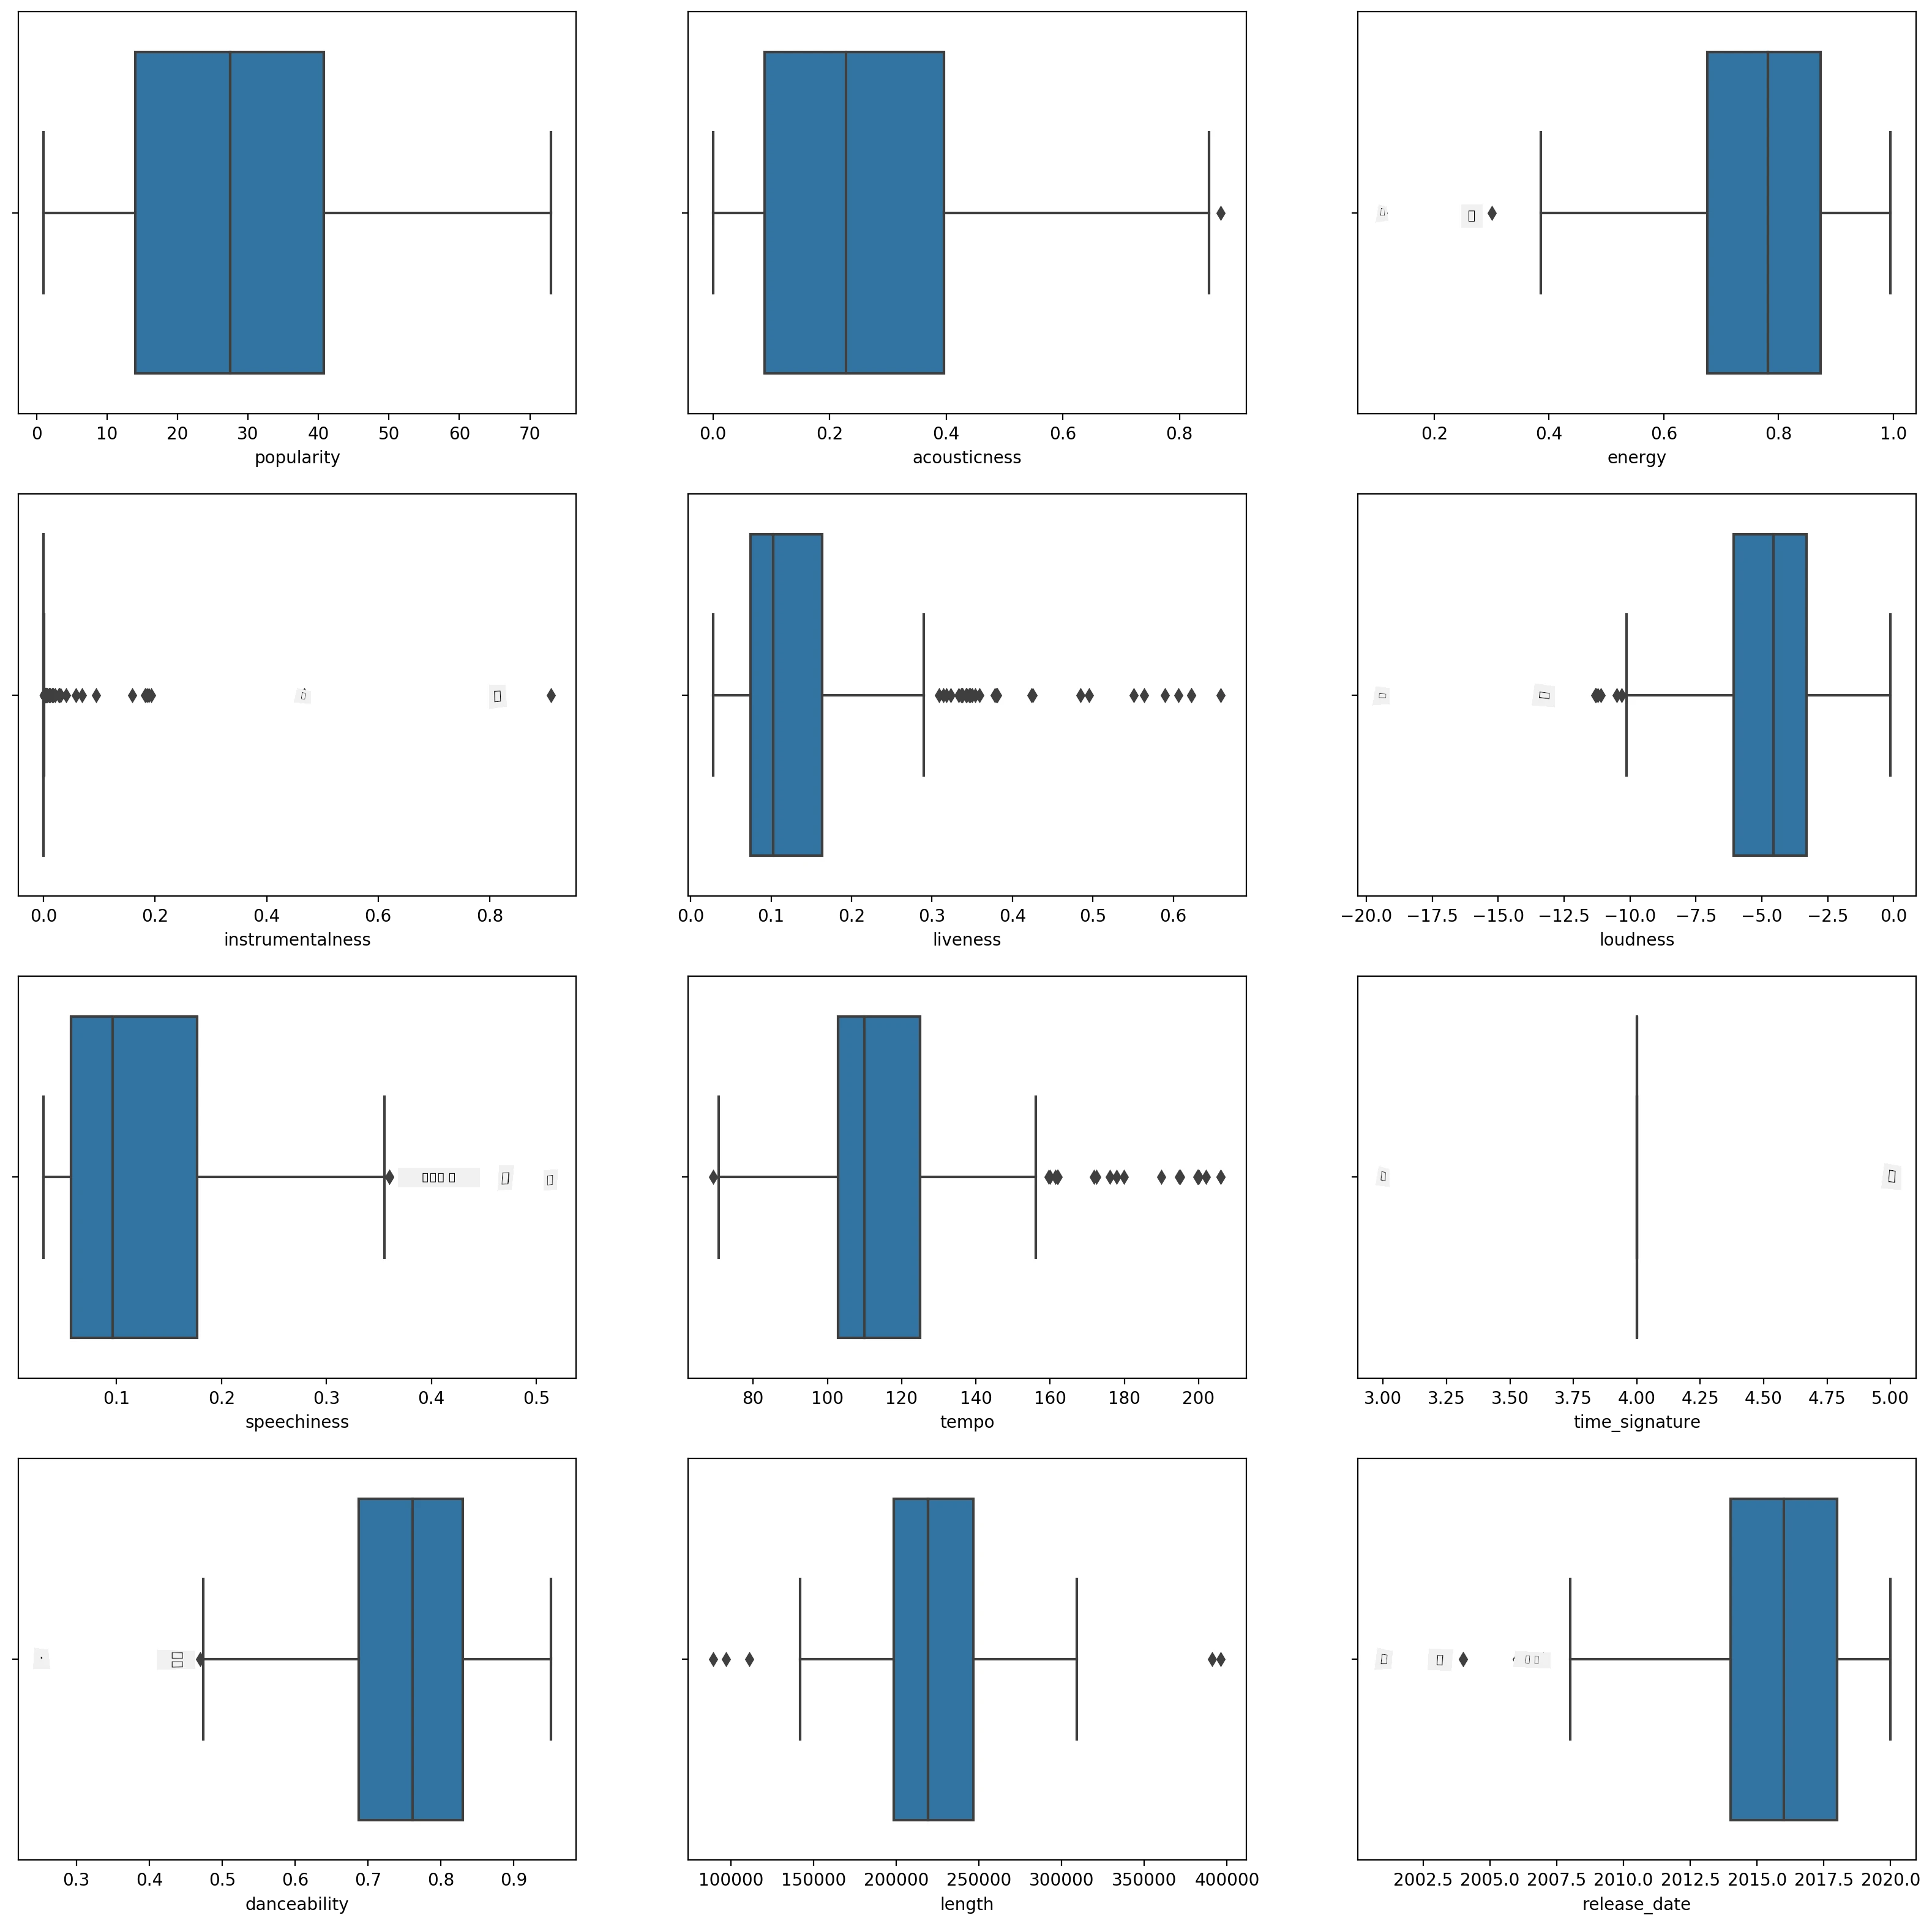
You fit go through di dataset and remove di outliers, but e go make di data small.
-
For now, choose which columns you go use for your clustering exercise. Pick di ones wey get similar ranges and encode di
artist_top_genrecolumn as numeric data:from sklearn.preprocessing import LabelEncoder le = LabelEncoder() X = df.loc[:, ('artist_top_genre','popularity','danceability','acousticness','loudness','energy')] y = df['artist_top_genre'] X['artist_top_genre'] = le.fit_transform(X['artist_top_genre']) y = le.transform(y) -
Now you need to pick how many clusters to target. You sabi say 3 song genres dey wey we carve out from di dataset, so make we try 3:
from sklearn.cluster import KMeans

nclusters = 3
seed = 0

km = KMeans(n_clusters=nclusters, random_state=seed)
km.fit(X)

# Predict the cluster for each data point

y_cluster_kmeans = km.predict(X)
y_cluster_kmeans
You go see one array wey print out wit predicted clusters (0, 1, or 2) for each row of di dataframe.
-
Use dis array to calculate one 'silhouette score':
from sklearn import metrics
score = metrics.silhouette_score(X, y_cluster_kmeans)
score
Silhouette score
Look for one silhouette score wey dey close to 1. Dis score dey vary from -1 to 1, and if di score na 1, di cluster dey dense and e dey well-separated from other clusters. Value wey near 0 dey represent overlapping clusters wit samples wey dey very close to di decision boundary of di neighboring clusters. (Source)
Our score na .53, so e dey middle. Dis show say our data no too fit dis type of clustering, but make we continue.
Exercise - build a model
-
Import
KMeansand start di clustering process.from sklearn.cluster import KMeans wcss = [] for i in range(1, 11): kmeans = KMeans(n_clusters = i, init = 'k-means++', random_state = 42) kmeans.fit(X) wcss.append(kmeans.inertia_)Some parts dey here wey need explanation.
🎓 range: Na di iterations of di clustering process
🎓 random_state: "E dey determine random number generation for centroid initialization." Source
🎓 WCSS: "within-cluster sums of squares" dey measure di squared average distance of all di points inside one cluster to di cluster centroid. Source.
🎓 Inertia: K-Means algorithms dey try choose centroids to minimize 'inertia', "one measure of how internally coherent clusters dey." Source. Di value dey append to di wcss variable for each iteration.
🎓 k-means++: For Scikit-learn you fit use di 'k-means++' optimization, wey "dey initialize di centroids to dey (generally) far from each other, wey fit lead to better results than random initialization.
Elbow method
Before, you don reason say, because you dey target 3 song genres, you suppose choose 3 clusters. But e sure?
-
Use di 'elbow method' to confirm.
plt.figure(figsize=(10,5))
sns.lineplot(x=range(1, 11), y=wcss, marker='o', color='red')
plt.title('Elbow')
plt.xlabel('Number of clusters')
plt.ylabel('WCSS')
plt.show()
Use di
wcssvariable wey you build for di previous step to create one chart wey dey show where di 'bend' for di elbow dey, wey dey indicate di optimum number of clusters. Maybe e dey 3!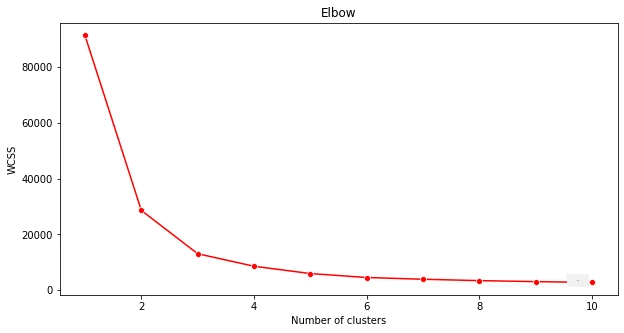
Exercise - display di clusters
-
Try di process again, dis time set three clusters, and display di clusters as scatterplot:
from sklearn.cluster import KMeans kmeans = KMeans(n_clusters = 3) kmeans.fit(X) labels = kmeans.predict(X) plt.scatter(df['popularity'],df['danceability'],c = labels) plt.xlabel('popularity') plt.ylabel('danceability') plt.show() -
Check di model accuracy:
labels = kmeans.labels_

correct_labels = sum(y == labels)

print("Result: %d out of %d samples were correctly labeled." % (correct_labels, y.size))

print('Accuracy score: {0:0.2f}'. format(correct_labels/float(y.size)))
Dis model accuracy no too good, and di shape of di clusters dey give you hint why.
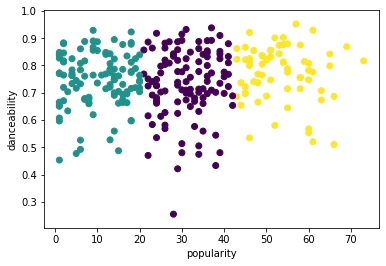
Dis data dey too imbalanced, e no too correlate and di variance between di column values too much to cluster well. In fact, di clusters wey form fit dey heavily influenced or skewed by di three genre categories wey we define above. Na learning process!
For Scikit-learn documentation, you fit see say model like dis one, wit clusters wey no too demarcate well, get 'variance' problem:
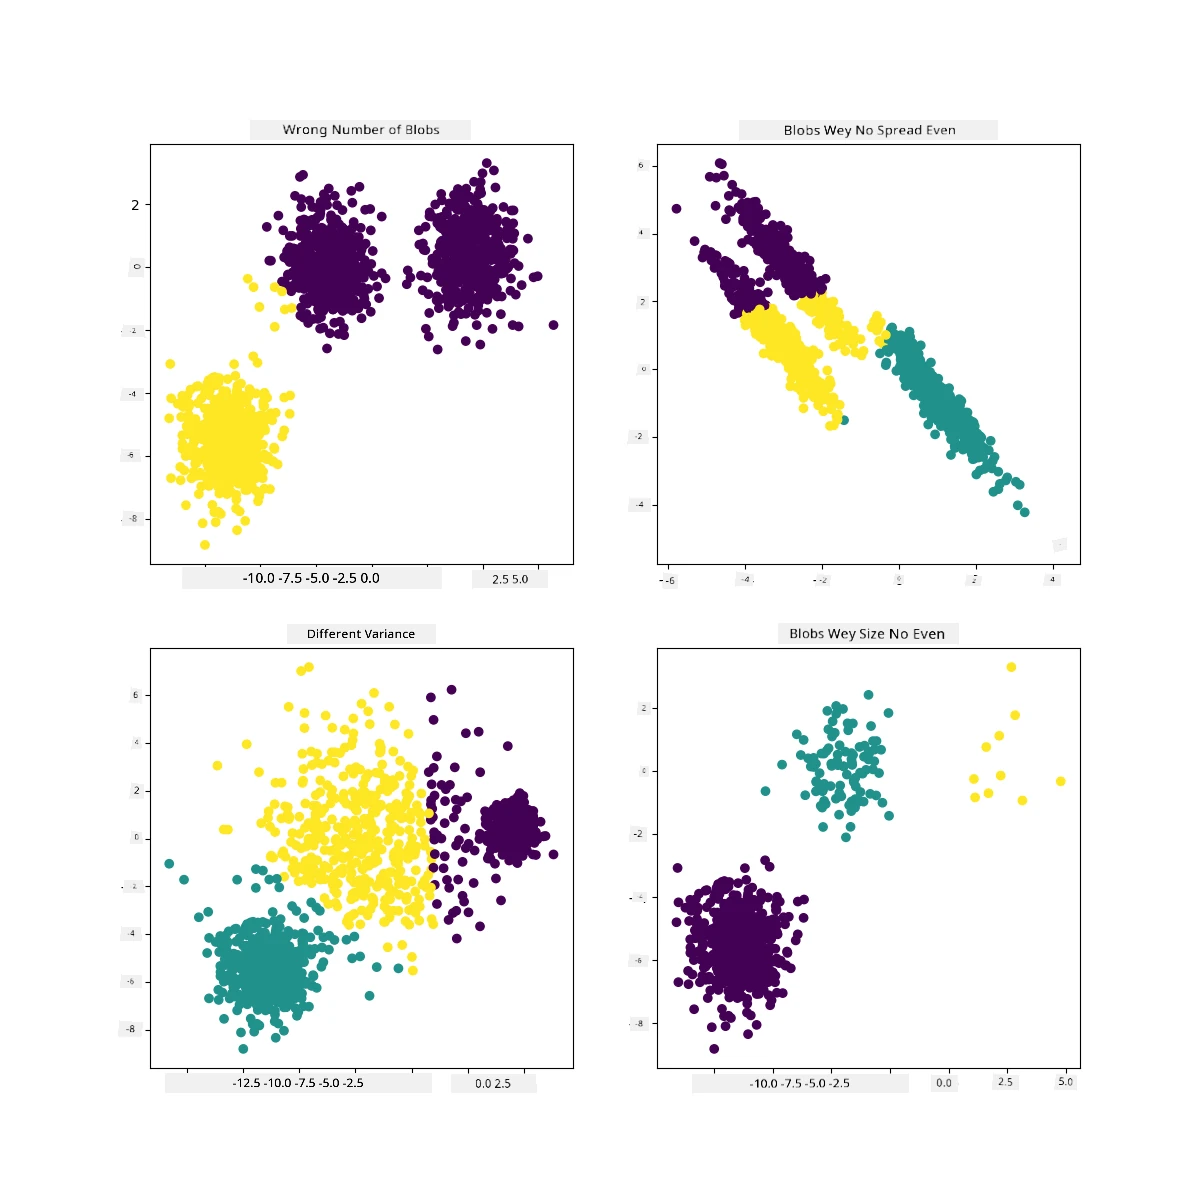
Infographic from Scikit-learn
Variance
Variance na "di average of di squared differences from di Mean" (Source). For di context of dis clustering problem, e mean say di numbers for our dataset dey diverge too much from di mean.
✅ Dis na good time to think about all di ways wey you fit correct dis issue. Tweak di data small? Use different columns? Use different algorithm? Hint: Try scaling your data to normalize am and test other columns.
Try dis 'variance calculator' to understand di concept well.
🚀Challenge
Spend time wit dis notebook, tweak di parameters. You fit improve di accuracy of di model by cleaning di data more (remove outliers, for example)? You fit use weights to give more weight to given data samples. Wetin else you fit do to create better clusters?
Hint: Try to scale your data. Di notebook get commented code wey add standard scaling to make di data columns resemble each other more closely in terms of range. You go find say while di silhouette score go go down, di 'kink' for di elbow graph go smooth out. Dis na because if you leave di data unscaled, e go allow data wey get less variance to carry more weight. Read more about dis problem here.
Post-lecture quiz
Review & Self Study
Check one K-Means Simulator like dis one. You fit use dis tool to visualize sample data points and determine di centroids. You fit edit di data randomness, numbers of clusters and numbers of centroids. E dey help you get idea of how di data fit dey grouped?
Also, check dis handout on K-Means from Stanford.
Assignment
Try different clustering methods
Disclaimer:
Dis dokyument don use AI transle-shun service Co-op Translator do di transle-shun. Even as we dey try make am correct, abeg sabi say transle-shun wey machine do fit get mistake or no dey accurate. Di original dokyument for im native language na di one wey you go take as di correct source. For important mata, e good make professional human transle-shun dey use. We no go fit take blame for any misunderstanding or wrong interpretation wey fit happen because you use dis transle-shun.