# ARIMA로 Time series forecasting 하기
이전 강의에서, time series forecasting에 대해 약간 배웠고 시간대 간격으로 전력 부하의 파동을 보여주는 데이터셋도 불러왔습니다.
[](https://youtu.be/IUSk-YDau10 "Introduction to ARIMA")
> 🎥 영상을 보려면 이미지 클릭: A brief introduction to ARIMA models. The example is done in R, but the concepts are universal.
## [강의 전 퀴즈](https://gentle-hill-034defd0f.1.azurestaticapps.net/quiz/43/)
## 소개
이 강의에서, [ARIMA: *A*uto*R*egressive *I*ntegrated *M*oving *A*verage](https://wikipedia.org/wiki/Autoregressive_integrated_moving_average)로 모델을 만드는 상세한 방식을 살펴볼 예정입니다. ARIMA 모델은 [non-stationarity](https://wikipedia.org/wiki/Stationary_process)를 보여주는 데이터에 특히 알맞습니다.
## 일반적인 컨셉
ARIMA로 작업하려고 한다면, 일부 컨셉을 알 필요가 있습니다:
- 🎓 **Stationarity**. 통계 컨텍스트에서, stationarity는 시간이 지나면서 분포가 변경되지 않는 데이터를 나타냅니다. Non-stationary 데이터라면, 분석하기 위해서 변환이 필요한 트랜드로 파동을 보여줍니다. 예시로, Seasonality는, 데이터에 파동을 나타나게 할 수 있고 'seasonal-differencing' 처리로 뺄 수 있습니다.
- 🎓 **[Differencing](https://wikipedia.org/wiki/Autoregressive_integrated_moving_average#Differencing)**. Differencing 데이터는, 통계 컨텍스트에서 다시 언급하자면, non-stationary 데이터를 non-constant 트랜드로 지워서 움직이지 않게 변형시키는 프로세스를 나타냅니다. "Differencing removes the changes in the level of a time series, eliminating trend and seasonality and consequently stabilizing the mean of the time series." [Paper by Shixiong et al](https://arxiv.org/abs/1904.07632)
## Time series의 컨텍스트에서 ARIMA
ARIMA의 파트를 언팩해서 어떻게 time series 모델을 만들고 예측하는 데에 도움을 주는지 더 이해합니다.
- **AR - for AutoRegressive**. 이름에서 추측하듯, Autoregressive 모델은, 데이터에서 이전 값을 분석하고 가정하기 위해서 시간을 'back' 합니다. 이전 값은 'lags'이라고 불립니다. 예시로 연필의 월별 판매를 보여주는 데이터가 존재합니다. 각 월별 판매 총액은 데이터셋에서 'evolving variable'으로 생각됩니다. 이 모델은 "evolving variable of interest is regressed on its own lagged (i.e., prior) values."로 만들어졌습니다. [wikipedia](https://wikipedia.org/wiki/Autoregressive_integrated_moving_average)
- **I - for Integrated**. 비슷한 'ARMA' 모델과 다르게, ARIMA의 'I'는 *[integrated](https://wikipedia.org/wiki/Order_of_integration)* 측면을 나타냅니다. non-stationarity를 제거하기 위해서 differencing 단계가 적용될 때 데이터는 'integrated'됩니다.
- **MA - for Moving Average**. 이 모델의 [moving-average](https://wikipedia.org/wiki/Moving-average_model) 측면에서 lags의 현재와 과거 값을 지켜봐서 결정하는 출력 변수를 나타냅니다.
결론: ARIMA는 가능한 근접하게 time series 데이터의 스페셜 폼에 맞는 모델을 만들기 위해서 사용합니다.
## 연습 - ARIMA 모델 만들기
이 강의의 _/working_ 폴더를 열고 _notebook.ipynb_ 파일을 찾습니다.
1. 노트북을 실행해서 `statsmodels` Python 라이브러리를 불러옵니다; ARIMA 모델이 필요할 예정입니다.
1. 필요한 라이브러리를 불러옵니다
1. 지금부터, 데이터를 plot할 때 유용한 여러 라이브러리를 불러옵니다:
```python
import os
import warnings
import matplotlib.pyplot as plt
import numpy as np
import pandas as pd
import datetime as dt
import math
from pandas.plotting import autocorrelation_plot
from statsmodels.tsa.statespace.sarimax import SARIMAX
from sklearn.preprocessing import MinMaxScaler
from common.utils import load_data, mape
from IPython.display import Image
%matplotlib inline
pd.options.display.float_format = '{:,.2f}'.format
np.set_printoptions(precision=2)
warnings.filterwarnings("ignore") # specify to ignore warning messages
```
1. `/data/energy.csv` 파일의 데이터를 Pandas 데이터프레임으로 불러오고 찾아봅니다:
```python
energy = load_data('./data')[['load']]
energy.head(10)
```
1. January 2012부터 December 2014까지 유효한 에너지 데이터를 모두 plot합니다. 지난 강의에서 보았던 데이터라서 놀랍지 않습니다:
```python
energy.plot(y='load', subplots=True, figsize=(15, 8), fontsize=12)
plt.xlabel('timestamp', fontsize=12)
plt.ylabel('load', fontsize=12)
plt.show()
```
지금부터, 모델을 만들어봅시다!
### 훈련과 테스트 데이터셋 만들기
이제 데이터를 불러왔으면, 훈련과 테스트 셋으로 나눌 수 있습니다. 훈련 셋으로 모델을 훈련할 수 있습니다. 평소처럼, 모델 훈련이 끝나면, 데이터셋으로 정확도를 평가합니다. 모델이 미래에서 정보를 못 얻도록 테스트셋이 훈련 셋의 이후 기간을 커버하는지 확인할 필요가 있습니다.
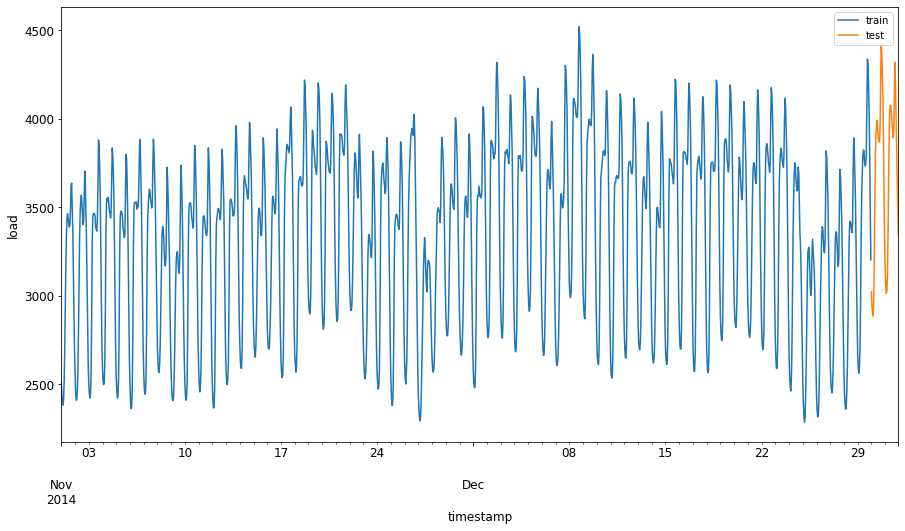
1. 2014년 September 1 부터 October 31 까지 2개월간 훈련 셋에 할당합니다. 테스트셋은 2014년 November 1 부터 December 31 까지 2개월간 포함합니다:
```python
train_start_dt = '2014-11-01 00:00:00'
test_start_dt = '2014-12-30 00:00:00'
```
이 데이터는 에너지의 일일 소비 수량을 반영하므로, 강한 계절적 패턴이 있지만, 소비 수량은 최근 날짜와 매우 비슷합니다.
1. 다른 점을 시각화합니다:
```python
energy[(energy.index < test_start_dt) & (energy.index >= train_start_dt)][['load']].rename(columns={'load':'train'}) \
.join(energy[test_start_dt:][['load']].rename(columns={'load':'test'}), how='outer') \
.plot(y=['train', 'test'], figsize=(15, 8), fontsize=12)
plt.xlabel('timestamp', fontsize=12)
plt.ylabel('load', fontsize=12)
plt.show()
```

그래서, 데이터를 훈련하면 상대적으로 적은 시간대로도 충분해야 합니다.
> 노트: ARIMA 모델을 fit할 때 사용하는 함수는 fitting하는 동안 in-sample 검증하므로, 검증 데이터를 생략할 예정입니다.
### 훈련을 위한 데이터 준비하기
지금부터, 데이터 필터링하고 스케일링한 훈련 데이터를 준비할 필요가 있습니다. 필요한 시간대와 열만 포함된 데이터셋을 필터링하고, 0,1 간격으로 데이터를 예측하도록 확장합니다.
1. 세트 별로 앞서 말해둔 기간만 포함하고 날짜가 추가된 'load' 열만 포함해서 원본 데이터셋을 필터링합니다:
```python
train = energy.copy()[(energy.index >= train_start_dt) & (energy.index < test_start_dt)][['load']]
test = energy.copy()[energy.index >= test_start_dt][['load']]
print('Training data shape: ', train.shape)
print('Test data shape: ', test.shape)
```
데이터의 모양을 볼 수 있습니다:
```output
Training data shape: (1416, 1)
Test data shape: (48, 1)
```
1. (0, 1) 범위로 데이터를 스케일링합니다:
```python
scaler = MinMaxScaler()
train['load'] = scaler.fit_transform(train)
train.head(10)
```
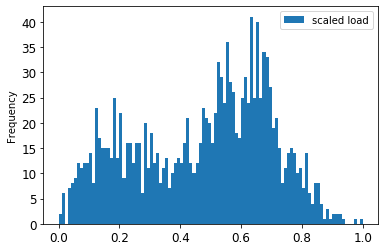
1. 원본 vs. 스케일된 데이터를 시각화합니다:
```python
energy[(energy.index >= train_start_dt) & (energy.index < test_start_dt)][['load']].rename(columns={'load':'original load'}).plot.hist(bins=100, fontsize=12)
train.rename(columns={'load':'scaled load'}).plot.hist(bins=100, fontsize=12)
plt.show()
```

> 원본 데이터

> 스케일된 데이터
1. 지금부터 스케일된 데이터를 보정했으므로, 테스트 데이터로 스케일할 수 있습니다:
```python
test['load'] = scaler.transform(test)
test.head()
```
### ARIMA 구현하기
ARIMA를 구현할 시간입니다! 미리 설치해둔 `statsmodels` 라이브러리를 지금 사용하겠습니다.
이제 다음 몇 단계가 필요합니다
1. `SARIMAX()`을 불러서 데이터를 정의하고 모델 파라미터를 전달합니다: p, d, 그리고 q 파라미터와, P, D, 그리고 Q 파라미터.
2. fit() 함수를 불러서 훈련 데이터을 위한 모델을 준비합니다.
3. `forecast()` 함수를 부르고 예측할 단계 숫자를 (`horizon`) 지정해서 예측합니다.
> 🎓 모든 파라미터는 무엇을 위해서 있나요? ARIMA 모델에 time series의 주요 측면을 모델링 도울 때 사용하는 3개 파라미터가 있습니다: seasonality, trend, 그리고 noise. 파라미터는 이렇습니다:
`p`: *past* 값을 합치는, 모델의 auto-regressive 측면과 관련있는 파라미터입니다.
`d`: time series에 적용할 *differencing* (🎓 differencing을 기억하나요 👆?) 결과에 영향받는, 모델의 통합 파트와 관련있는 파라미터입니다.
`q`: 모델의 moving-average 파트와 관련있는 파라미터입니다.
> 노트: 데이터에 - 이러한 것처럼 - 계절적 측면이 있다면, seasonal ARIMA 모델 (SARIMA)을 사용합니다. 이러한 케이스에는 다른 파라미터 셋을 사용할 필요가 있습니다: `P`, `D`와, `Q`는 `p`, `d`와, `q`처럼 같은 집단이라는 점을 설명하지만, 모델의 계절적 컴포넌트에 대응합니다.
1. 선호하는 horizon 값을 세팅하며 시작합니다. 3시간 동안 시도해봅시다:
```python
# Specify the number of steps to forecast ahead
HORIZON = 3
print('Forecasting horizon:', HORIZON, 'hours')
```
ARIMA 파라미터의 최적 값을 선택하는 것은 다소 주관적이고 시간이 많이 지나므로 어려울 수 있습니다. [`pyramid` library](https://alkaline-ml.com/pmdarima/0.9.0/modules/generated/pyramid.arima.auto_arima.html)에서 `auto_arima()` 함수로 사용하는 것을 고려할 수 있습니다.
1. 지금 당장 좋은 모델을 찾고자 약간 수동으로 선택하려고 합니다.
```python
order = (4, 1, 0)
seasonal_order = (1, 1, 0, 24)
model = SARIMAX(endog=train, order=order, seasonal_order=seasonal_order)
results = model.fit()
print(results.summary())
```
결과 테이블이 출력되었습니다.
첫 모델을 만들었습니다! 지금부터 평가하는 방식을 찾을 필요가 있습니다.
### 모델 평가하기
모델을 평가하려면, `walk forward` 검증이라 불리는 것을 할 수 있습니다. 연습에서, time series 모델은 새로운 데이터를 사용할 수 있는 순간마다 다시-훈련하고 있습니다. 모델은 각 time step마다 최적 예측을 하게 됩니다.
이 기술로 time series의 초반부터 시작해서, 훈련 데이터셋으로 모델을 훈련합니다. 다음 time step에서 예측하게 됩니다. 예측은 알려진 값을 기반으로 평가하게 됩니다. 훈련 셋은 알려진 값을 포함해서 확장하고 프로세스가 반복하게 됩니다.
> 노트: 세트의 초반부터 관측치를 지울 수 있는, 훈련 셋에서 새로운 관측치를 추가할 때마다 효과적인 훈련을 위해 훈련 셋 window를 고정해서 유지해야 합니다.
이 프로세스는 실전에서 모델이 어떻게 할 지에 대해서 강하게 추정하도록 제공합니다. 그러나, 많은 모델을 만들면 계산 비용이 생깁니다. 이는 데이터가 작거나 모델이 간단하지만, 스케일에 이슈가 있을 때 받아들일 수 있습니다.
Walk-forward 검사는 time series 모델 평가의 최적 표준이고 이 프로젝트에 추천됩니다.
1. 먼저, 각자 HORIZON 단계에 테스트 데이터 포인트를 만듭니다.
```python
test_shifted = test.copy()
for t in range(1, HORIZON + 1):
test_shifted['load+'+str(t)] = test_shifted['load'].shift(-t, freq='H')
test_shifted = test_shifted.dropna(how='any')
test_shifted.head(5)
```
| | | load | load+1 | load+2 |
| ---------- | -------- | ---- | ------ | ------ |
| 2014-12-30 | 00:00:00 | 0.33 | 0.29 | 0.27 |
| 2014-12-30 | 01:00:00 | 0.29 | 0.27 | 0.27 |
| 2014-12-30 | 02:00:00 | 0.27 | 0.27 | 0.30 |
| 2014-12-30 | 03:00:00 | 0.27 | 0.30 | 0.41 |
| 2014-12-30 | 04:00:00 | 0.30 | 0.41 | 0.57 |
데이터는 horizon 포인트에 따라서 수평으로 이동합니다.
1. 테스트 데이터 길이의 크기로 반복해서 sliding window 방식으로 테스트 데이터를 예측합니다:
```python
%%time
training_window = 720 # dedicate 30 days (720 hours) for training
train_ts = train['load']
test_ts = test_shifted
history = [x for x in train_ts]
history = history[(-training_window):]
predictions = list()
order = (2, 1, 0)
seasonal_order = (1, 1, 0, 24)
for t in range(test_ts.shape[0]):
model = SARIMAX(endog=history, order=order, seasonal_order=seasonal_order)
model_fit = model.fit()
yhat = model_fit.forecast(steps = HORIZON)
predictions.append(yhat)
obs = list(test_ts.iloc[t])
# move the training window
history.append(obs[0])
history.pop(0)
print(test_ts.index[t])
print(t+1, ': predicted =', yhat, 'expected =', obs)
```
진행하고 있는 훈련을 볼 수 있습니다:
```output
2014-12-30 00:00:00
1 : predicted = [0.32 0.29 0.28] expected = [0.32945389435989236, 0.2900626678603402, 0.2739480752014323]
2014-12-30 01:00:00
2 : predicted = [0.3 0.29 0.3 ] expected = [0.2900626678603402, 0.2739480752014323, 0.26812891674127126]
2014-12-30 02:00:00
3 : predicted = [0.27 0.28 0.32] expected = [0.2739480752014323, 0.26812891674127126, 0.3025962399283795]
```
1. 예측과 실제 부하를 비교합니다:
```python
eval_df = pd.DataFrame(predictions, columns=['t+'+str(t) for t in range(1, HORIZON+1)])
eval_df['timestamp'] = test.index[0:len(test.index)-HORIZON+1]
eval_df = pd.melt(eval_df, id_vars='timestamp', value_name='prediction', var_name='h')
eval_df['actual'] = np.array(np.transpose(test_ts)).ravel()
eval_df[['prediction', 'actual']] = scaler.inverse_transform(eval_df[['prediction', 'actual']])
eval_df.head()
```
output
| | | timestamp | h | prediction | actual |
| --- | ---------- | --------- | --- | ---------- | -------- |
| 0 | 2014-12-30 | 00:00:00 | t+1 | 3,008.74 | 3,023.00 |
| 1 | 2014-12-30 | 01:00:00 | t+1 | 2,955.53 | 2,935.00 |
| 2 | 2014-12-30 | 02:00:00 | t+1 | 2,900.17 | 2,899.00 |
| 3 | 2014-12-30 | 03:00:00 | t+1 | 2,917.69 | 2,886.00 |
| 4 | 2014-12-30 | 04:00:00 | t+1 | 2,946.99 | 2,963.00 |
실제 부하와 비교해서, 시간당 데이터의 예측을 관찰해봅니다. 어느정도 정확한가요?
### 모델 정확도 확인하기
모든 예측에서 mean absolute percentage error (MAPE)으로 테스트해서 모델의 정확도를 확인해봅니다.
> **🧮 Show me the math**
>
> 
>
> [MAPE](https://www.linkedin.com/pulse/what-mape-mad-msd-time-series-allameh-statistics/)은 다음 공식에서 정의된 비율로 정확도를 예측해서 보여주도록 사용됩니다. actualt 과 predictedt 사이의 차이점을 actualt로 나누게 됩니다. "The absolute value in this calculation is summed for every forecasted point in time and divided by the number of fitted points n." [wikipedia](https://wikipedia.org/wiki/Mean_absolute_percentage_error)
1. 코드로 방정식을 표현합니다:
```python
if(HORIZON > 1):
eval_df['APE'] = (eval_df['prediction'] - eval_df['actual']).abs() / eval_df['actual']
print(eval_df.groupby('h')['APE'].mean())
```
1. one step MAPE을 계산합니다:
```python
print('One step forecast MAPE: ', (mape(eval_df[eval_df['h'] == 't+1']['prediction'], eval_df[eval_df['h'] == 't+1']['actual']))*100, '%')
```
One step forecast MAPE: 0.5570581332313952 %
1. multi-step forecast MAPE을 출력합니다:
```python
print('Multi-step forecast MAPE: ', mape(eval_df['prediction'], eval_df['actual'])*100, '%')
```
```output
Multi-step forecast MAPE: 1.1460048657704118 %
```
최적으로 낮은 숫자가 가장 좋습니다: 10 MAPE이 10% 내려져서 예측되었다고 생각해봅니다.
1. 하지만 항상, 이 정확도 측정 종류를 시각적으로 보는 것이 더 쉬우므로, plot 해봅니다:
```python
if(HORIZON == 1):
## Plotting single step forecast
eval_df.plot(x='timestamp', y=['actual', 'prediction'], style=['r', 'b'], figsize=(15, 8))
else:
## Plotting multi step forecast
plot_df = eval_df[(eval_df.h=='t+1')][['timestamp', 'actual']]
for t in range(1, HORIZON+1):
plot_df['t+'+str(t)] = eval_df[(eval_df.h=='t+'+str(t))]['prediction'].values
fig = plt.figure(figsize=(15, 8))
ax = plt.plot(plot_df['timestamp'], plot_df['actual'], color='red', linewidth=4.0)
ax = fig.add_subplot(111)
for t in range(1, HORIZON+1):
x = plot_df['timestamp'][(t-1):]
y = plot_df['t+'+str(t)][0:len(x)]
ax.plot(x, y, color='blue', linewidth=4*math.pow(.9,t), alpha=math.pow(0.8,t))
ax.legend(loc='best')
plt.xlabel('timestamp', fontsize=12)
plt.ylabel('load', fontsize=12)
plt.show()
```

🏆 괜찮은 정확도로 모델을 보여주는, 매우 좋은 plot 입니다. 잘 마쳤습니다!
---
## 🚀 도전
Time Series 모델의 정확도를 테스트할 방식을 파봅니다. 이 강의에서 MAPE을 다루지만, 사용할 다른 방식이 있나요? 조사해보고 첨언해봅니다. 도움을 받을 수 있는 문서는 [here](https://otexts.com/fpp2/accuracy.html)에서 찾을 수 있습니다.
## [강의 후 퀴즈](https://gentle-hill-034defd0f.1.azurestaticapps.net/quiz/44/)
## 검토 & 자기주도 학습
이 강의에서 ARIMA로 Time Series Forecasting의 기초만 다룹니다. 시간을 내서 [this repository](https://microsoft.github.io/forecasting/)를 파보고 Time Series 모델 만드는 다양한 방식을 배우기 위한 모델 타입도 깊게 알아봅니다.
## 과제
[A new ARIMA model](../assignment.md)