# Visualize location data
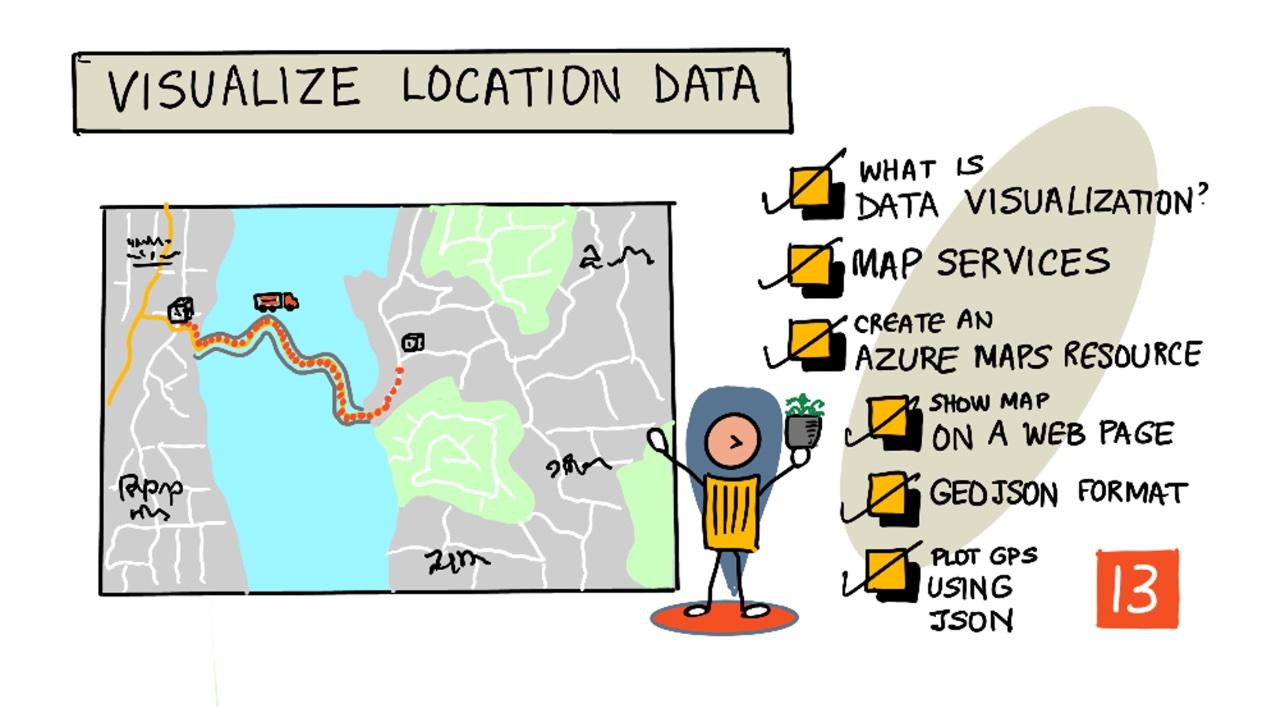
> Sketchnote by [Nitya Narasimhan](https://github.com/nitya). Click the image for a larger version.
This video provides an introduction to Azure Maps with IoT, a service that will be explored in this lesson.
[](https://www.youtube.com/watch?v=P5i2GFTtb2s)
> 🎥 Click the image above to watch the video
## Pre-lecture quiz
[Pre-lecture quiz](https://black-meadow-040d15503.1.azurestaticapps.net/quiz/25)
## Introduction
In the previous lesson, you learned how to collect GPS data from your sensors and save it to the cloud in a storage container using serverless code. Now, you'll learn how to visualize those data points on an Azure map. You'll discover how to create a map on a web page, understand the GeoJSON data format, and use it to plot all the captured GPS points on your map.
In this lesson, we’ll cover:
* [What is data visualization](../../../../../3-transport/lessons/3-visualize-location-data)
* [Map services](../../../../../3-transport/lessons/3-visualize-location-data)
* [Create an Azure Maps resource](../../../../../3-transport/lessons/3-visualize-location-data)
* [Show a map on a web page](../../../../../3-transport/lessons/3-visualize-location-data)
* [The GeoJSON format](../../../../../3-transport/lessons/3-visualize-location-data)
* [Plot GPS data on a Map using GeoJSON](../../../../../3-transport/lessons/3-visualize-location-data)
> 💁 This lesson involves a small amount of HTML and JavaScript. If you'd like to learn more about web development using HTML and JavaScript, check out [Web development for beginners](https://github.com/microsoft/Web-Dev-For-Beginners).
## What is data visualization
Data visualization is the process of representing data in ways that make it easier for humans to understand. While it's often associated with charts and graphs, it encompasses any method of visually representing data to help people not only comprehend it better but also make informed decisions.
For example, in the farm project, you collected soil moisture readings. A table of soil moisture data recorded hourly on June 1, 2021, might look like this:
| Date | Reading |
| ---------------- | ------: |
| 01/06/2021 00:00 | 257 |
| 01/06/2021 01:00 | 268 |
| 01/06/2021 02:00 | 295 |
| 01/06/2021 03:00 | 305 |
| 01/06/2021 04:00 | 325 |
| 01/06/2021 05:00 | 359 |
| 01/06/2021 06:00 | 398 |
| 01/06/2021 07:00 | 410 |
| 01/06/2021 08:00 | 429 |
| 01/06/2021 09:00 | 451 |
| 01/06/2021 10:00 | 460 |
| 01/06/2021 11:00 | 452 |
| 01/06/2021 12:00 | 420 |
| 01/06/2021 13:00 | 408 |
| 01/06/2021 14:00 | 431 |
| 01/06/2021 15:00 | 462 |
| 01/06/2021 16:00 | 432 |
| 01/06/2021 17:00 | 402 |
| 01/06/2021 18:00 | 387 |
| 01/06/2021 19:00 | 360 |
| 01/06/2021 20:00 | 358 |
| 01/06/2021 21:00 | 354 |
| 01/06/2021 22:00 | 356 |
| 01/06/2021 23:00 | 362 |
For a human, interpreting this data can be challenging—it’s just a wall of numbers. To make it more comprehensible, you could plot it on a line chart:
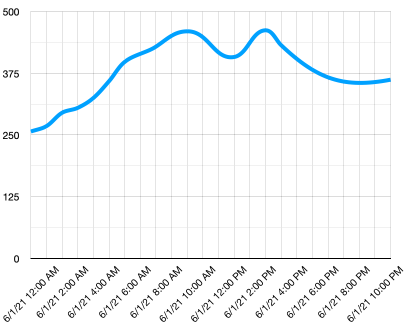
This visualization can be further improved by adding a line to indicate when the automated watering system was activated at a soil moisture reading of 450:
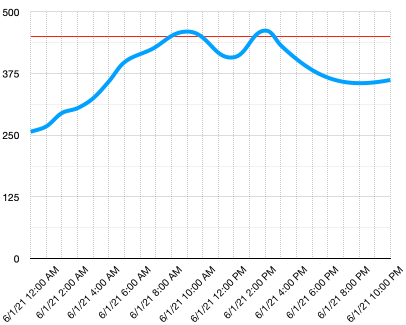
This chart quickly conveys not only the soil moisture levels but also the points where the watering system was triggered.
Charts are just one way to visualize data. IoT devices that monitor weather conditions might use web or mobile apps to display weather data with symbols, such as a cloud for cloudy days or a rain cloud for rainy days. There are countless ways to visualize data—some serious, others more playful.
✅ Think about the ways you've seen data visualized. Which methods were the clearest and helped you make decisions the fastest?
The best visualizations enable humans to make decisions quickly. For instance, a wall of gauges showing various readings from industrial machinery can be overwhelming, but a flashing red light when something goes wrong allows a person to act immediately. Sometimes, the simplest visualization—like a flashing light—is the most effective.
When working with GPS data, the clearest visualization is often plotting the data on a map. For example, a map showing delivery trucks can help workers at a processing plant anticipate when trucks will arrive. If the map also provides information about the trucks' contents, workers can plan accordingly—e.g., preparing space in a fridge for an incoming refrigerated truck.
## Map services
Working with maps is an exciting challenge, and there are many options to choose from, such as Bing Maps, Leaflet, Open Street Maps, and Google Maps. In this lesson, you'll learn about [Azure Maps](https://azure.microsoft.com/services/azure-maps/?WT.mc_id=academic-17441-jabenn) and how it can display your GPS data.
Azure Maps is "a collection of geospatial services and SDKs that use fresh mapping data to provide geographic context to web and mobile applications." It offers developers tools to create interactive maps with features like recommended traffic routes, traffic incident information, indoor navigation, search capabilities, elevation data, weather services, and more.
✅ Try out some [mapping code samples](https://docs.microsoft.com/samples/browse?WT.mc_id=academic-17441-jabenn&products=azure-maps)
Azure Maps allows you to display maps in various styles, such as blank canvases, tiles, satellite images, satellite images with roads, grayscale maps, shaded relief maps for elevation, night view maps, and high-contrast maps. You can integrate real-time updates into your maps using [Azure Event Grid](https://azure.microsoft.com/services/event-grid/?WT.mc_id=academic-17441-jabenn). You can also customize the behavior and appearance of your maps by enabling controls for interactions like pinch, drag, and click. To further customize the look, you can add layers such as bubbles, lines, polygons, heat maps, and more. The choice of map style depends on the SDK you use.
You can access Azure Maps APIs through its [REST API](https://docs.microsoft.com/javascript/api/azure-maps-rest/?WT.mc_id=academic-17441-jabenn&view=azure-maps-typescript-latest), its [Web SDK](https://docs.microsoft.com/azure/azure-maps/how-to-use-map-control?WT.mc_id=academic-17441-jabenn), or its [Android SDK](https://docs.microsoft.com/azure/azure-maps/how-to-use-android-map-control-library?WT.mc_id=academic-17441-jabenn&pivots=programming-language-java-android) for mobile apps.
In this lesson, you'll use the Web SDK to draw a map and display the GPS path of your sensor.
## Create an Azure Maps resource
The first step is to create an Azure Maps account.
### Task - create an Azure Maps resource
1. Run the following command in your Terminal or Command Prompt to create an Azure Maps resource in your `gps-sensor` resource group:
```sh
az maps account create --name gps-sensor \
--resource-group gps-sensor \
--accept-tos \
--sku S1
```
This will create an Azure Maps resource called `gps-sensor`. The `S1` tier is a paid tier that includes a variety of features, with a generous number of free calls.
> 💁 To learn about the cost of using Azure Maps, visit the [Azure Maps pricing page](https://azure.microsoft.com/pricing/details/azure-maps/?WT.mc_id=academic-17441-jabenn).
2. You'll need an API key for the maps resource. Use the following command to retrieve this key:
```sh
az maps account keys list --name gps-sensor \
--resource-group gps-sensor \
--output table
```
Copy the `PrimaryKey` value.
## Show a map on a web page
Next, you'll display your map on a web page. For simplicity, we'll use a single `html` file for this small web app. In a production or team environment, your web app will likely have more components.
### Task - show a map on a web page
1. Create a file called `index.html` in a folder on your local computer. Add HTML markup to hold a map:
```html
```
The map will load in the `myMap` `div`. A few styles ensure it spans the width and height of the page.
> 🎓 A `div` is a section of a web page that can be named and styled.
2. Under the opening `` tag, add an external style sheet to control the map display and an external script from the Web SDK to manage its behavior:
```html
```
This style sheet defines how the map looks, and the script file contains code to load the map. Adding this code is similar to including C++ header files or importing Python modules.
3. Below that script, add a script block to initialize the map:
```javascript
```
Replace `` with the API key for your Azure Maps account.
If you open your `index.html` file in a web browser, you should see a map centered on the Seattle area.
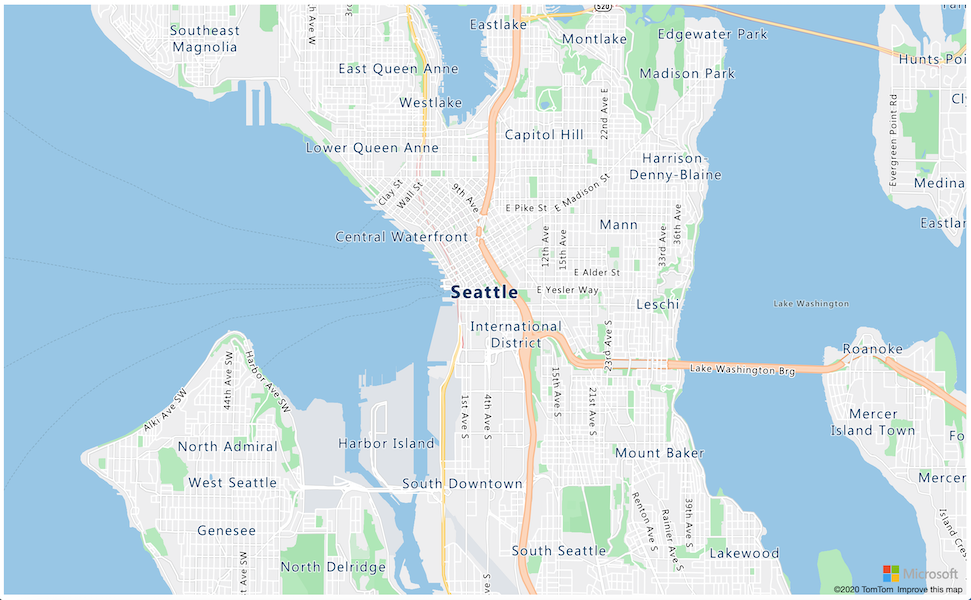
✅ Experiment with the zoom and center parameters to adjust your map display. You can use different coordinates corresponding to your data's latitude and longitude to re-center the map.
> 💁 A better way to work with web apps locally is to install [http-server](https://www.npmjs.com/package/http-server). You'll need [node.js](https://nodejs.org/) and [npm](https://www.npmjs.com/) installed to use this tool. Once installed, navigate to your `index.html` file's location and type `http-server`. The web app will open on a local web server at [http://127.0.0.1:8080/](http://127.0.0.1:8080/).
## The GeoJSON format
Now that your web app displays a map, the next step is to extract GPS data from your storage account and display it as markers on the map. Before doing that, let’s explore the [GeoJSON](https://wikipedia.org/wiki/GeoJSON) format required by Azure Maps.
[GeoJSON](https://geojson.org/) is an open standard JSON specification designed to handle geographic data. You can learn about it by testing sample data using [geojson.io](https://geojson.io), which is also a helpful tool for debugging GeoJSON files.
Sample GeoJSON data looks like this:
```json
{
"type": "FeatureCollection",
"features": [
{
"type": "Feature",
"geometry": {
"type": "Point",
"coordinates": [
-2.10237979888916,
57.164918677004714
]
}
}
]
}
```
Key elements include the `Feature` nested within a `FeatureCollection`. Inside, the `geometry` object contains `coordinates` specifying latitude and longitude.
✅ When building your GeoJSON, ensure the order of `latitude` and `longitude` is correct, or your points will appear in the wrong locations! GeoJSON expects coordinates in the order `lon,lat` for points, not `lat,lon`.
`Geometry` can have different types, such as a single point or a polygon. In this example, it’s a point with two coordinates: longitude and latitude.
✅ Azure Maps supports standard GeoJSON along with some [enhanced features](https://docs.microsoft.com/azure/azure-maps/extend-geojson?WT.mc_id=academic-17441-jabenn), such as the ability to draw circles and other geometries.
## Plot GPS data on a Map using GeoJSON
Now you’re ready to use the data stored in the storage account you set up in the previous lesson. As a reminder, the data is stored as multiple files in blob storage, so you’ll need to retrieve and parse these files for Azure Maps to utilize them.
### Task - Configure storage for web page access
If you attempt to fetch data from your storage, you might notice errors in your browser’s console. This happens because you need to configure [CORS](https://developer.mozilla.org/docs/Web/HTTP/CORS) permissions on the storage account to allow external web applications to access its data.
> 🎓 CORS stands for "Cross-Origin Resource Sharing" and typically needs to be explicitly configured in Azure for security purposes. It prevents unauthorized websites from accessing your data.
1. Run the following command to enable CORS:
```sh
az storage cors add --methods GET \
--origins "*" \
--services b \
--account-name \
--account-key
```
Replace `` with the name of your storage account. Replace `` with the account key for your storage account.
This command allows any website (the wildcard `*` means any) to make a *GET* request to retrieve data from your storage account. The `--services b` parameter ensures this setting applies only to blobs.
### Task - Load GPS data from storage
1. Replace the entire contents of the `init` function with the following code:
```javascript
fetch("https://.blob.core.windows.net/gps-data/?restype=container&comp=list")
.then(response => response.text())
.then(str => new window.DOMParser().parseFromString(str, "text/xml"))
.then(xml => {
let blobList = Array.from(xml.querySelectorAll("Url"));
blobList.forEach(async blobUrl => {
loadJSON(blobUrl.innerHTML)
});
})
.then( response => {
map = new atlas.Map('myMap', {
center: [-122.26473, 47.73444],
zoom: 14,
authOptions: {
authType: "subscriptionKey",
subscriptionKey: "",
}
});
map.events.add('ready', function () {
var source = new atlas.source.DataSource();
map.sources.add(source);
map.layers.add(new atlas.layer.BubbleLayer(source));
source.add(features);
})
})
```
Replace `` with the name of your storage account. Replace `` with the API key for your Azure Maps account.
Here’s what the code does: First, it fetches your GPS data from the blob container using a URL endpoint constructed with your storage account name. This URL retrieves data from `gps-data`, indicating the resource type is a container (`restype=container`), and lists information about all the blobs. Instead of returning the blobs themselves, it provides a URL for each blob that can be used to access the blob data.
> 💁 You can paste this URL into your browser to view details of all the blobs in your container. Each item will have a `Url` property that you can also open in your browser to see the blob’s contents.
The code then loads each blob by calling a `loadJSON` function, which you’ll create next. It initializes the map control and adds code to the `ready` event. This event triggers when the map is displayed on the web page.
During the `ready` event, an Azure Maps data source is created—a container for GeoJSON data that will be populated later. This data source is then used to create a bubble layer, which displays circles on the map centered at each point in the GeoJSON.
1. Add the `loadJSON` function to your script block, below the `init` function:
```javascript
var map, features;
function loadJSON(file) {
var xhr = new XMLHttpRequest();
features = [];
xhr.onreadystatechange = function () {
if (xhr.readyState === XMLHttpRequest.DONE) {
if (xhr.status === 200) {
gps = JSON.parse(xhr.responseText)
features.push(
new atlas.data.Feature(new atlas.data.Point([parseFloat(gps.gps.lon), parseFloat(gps.gps.lat)]))
)
}
}
};
xhr.open("GET", file, true);
xhr.send();
}
```
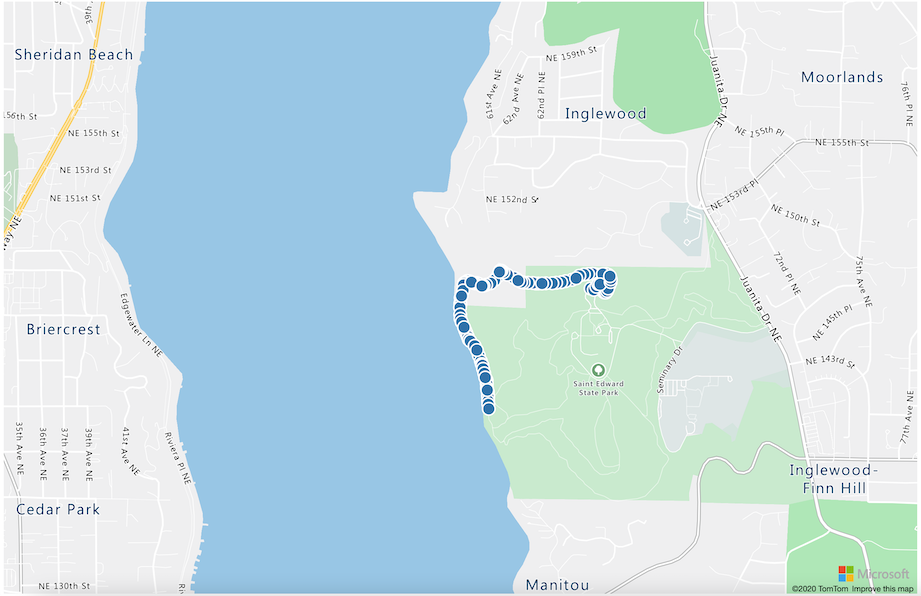
This function is called by the fetch routine to parse the JSON data and convert it into longitude and latitude coordinates in GeoJSON format. Once parsed, the data is added as a GeoJSON `Feature`. The map will initialize, and small bubbles will appear along the path plotted by your data.
1. Open the HTML page in your browser. The map will load, retrieve all the GPS data from storage, and plot it on the map.
> 💁 You can find this code in the [code](../../../../../3-transport/lessons/3-visualize-location-data/code) folder.
---
## 🚀 Challenge
Displaying static data on a map as markers is useful, but can you enhance this web app to add animation? Try showing the path of the markers over time using the timestamped JSON files. Here are [some samples](https://azuremapscodesamples.azurewebsites.net/) demonstrating how to use animation in maps.
## Post-lecture quiz
[Post-lecture quiz](https://black-meadow-040d15503.1.azurestaticapps.net/quiz/26)
## Review & Self Study
Azure Maps is particularly valuable for working with IoT devices.
* Explore its applications in the [Azure Maps documentation on Microsoft docs](https://docs.microsoft.com/azure/azure-maps/tutorial-iot-hub-maps?WT.mc_id=academic-17441-jabenn).
* Expand your knowledge of map creation and waypoints with the [Create your first route-finding app with Azure Maps self-guided learning module on Microsoft Learn](https://docs.microsoft.com/learn/modules/create-your-first-app-with-azure-maps/?WT.mc_id=academic-17441-jabenn).
## Assignment
[Deploy your app](assignment.md)
---
**Disclaimer**:
This document has been translated using the AI translation service [Co-op Translator](https://github.com/Azure/co-op-translator). While we aim for accuracy, please note that automated translations may include errors or inaccuracies. The original document in its native language should be regarded as the authoritative source. For critical information, professional human translation is advised. We are not responsible for any misunderstandings or misinterpretations resulting from the use of this translation.