# ビジュアライゼーション

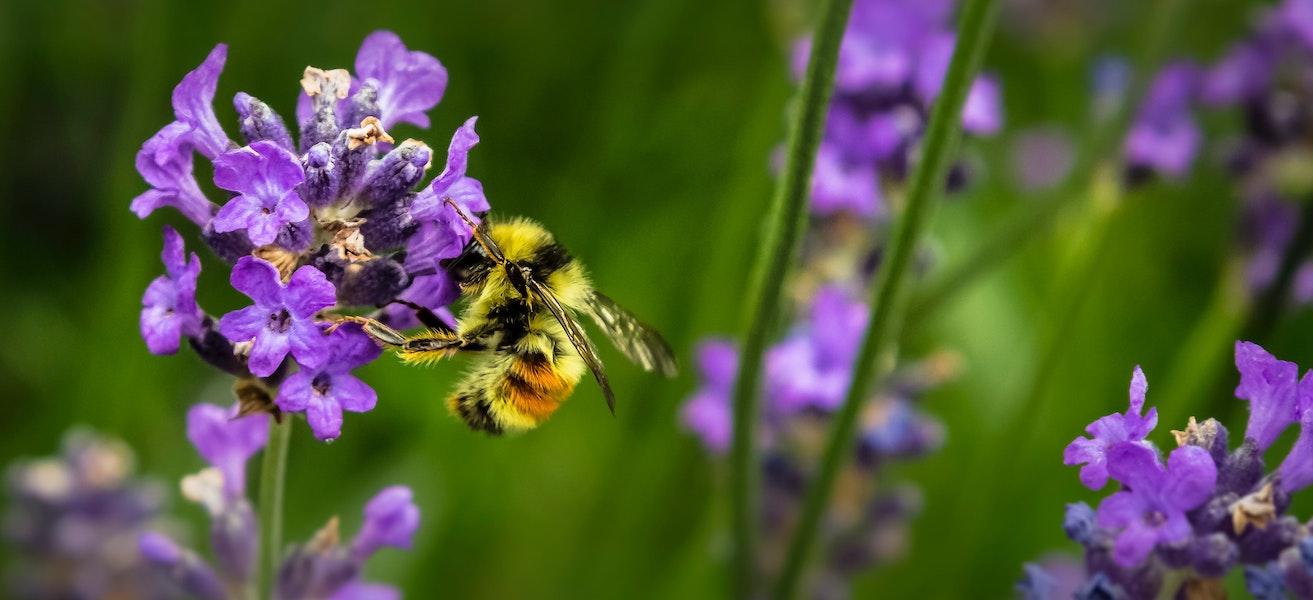
> 写真提供: Jenna Lee on Unsplash
データの可視化は、データサイエンティストにとって最も重要なタスクの1つです。画像は1000語に値すると言われるように、ビジュアライゼーションはデータの中に潜む興味深い部分、例えばスパイク、外れ値、グループ化、傾向などを特定し、データが語ろうとしているストーリーを理解する助けとなります。
これらの5つのレッスンでは、自然から得られたデータを探求し、さまざまな手法を用いて興味深く美しいビジュアライゼーションを作成します。
| トピック番号 | トピック | リンク先レッスン | 著者 |
| :-----------: | :--: | :-----------: | :----: |
| 1. | 数量の可視化 | - [Python](09-visualization-quantities/README.md)
- [R](../../../3-Data-Visualization/R/09-visualization-quantities)
| - [Jen Looper](https://twitter.com/jenlooper)
- [Vidushi Gupta](https://github.com/Vidushi-Gupta)
- [Jasleen Sondhi](https://github.com/jasleen101010)
|
| 2. | 分布の可視化 | - [Python](10-visualization-distributions/README.md)
- [R](../../../3-Data-Visualization/R/10-visualization-distributions)
| - [Jen Looper](https://twitter.com/jenlooper)
- [Vidushi Gupta](https://github.com/Vidushi-Gupta)
- [Jasleen Sondhi](https://github.com/jasleen101010)
|
| 3. | 比率の可視化 | - [Python](11-visualization-proportions/README.md)
- [R](../../../3-Data-Visualization)
| - [Jen Looper](https://twitter.com/jenlooper)
- [Vidushi Gupta](https://github.com/Vidushi-Gupta)
- [Jasleen Sondhi](https://github.com/jasleen101010)
|
| 4. | 関係性の可視化 | - [Python](12-visualization-relationships/README.md)
- [R](../../../3-Data-Visualization)
| - [Jen Looper](https://twitter.com/jenlooper)
- [Vidushi Gupta](https://github.com/Vidushi-Gupta)
- [Jasleen Sondhi](https://github.com/jasleen101010)
|
| 5. | 意味のあるビジュアライゼーションの作成 | - [Python](13-meaningful-visualizations/README.md)
- [R](../../../3-Data-Visualization)
| - [Jen Looper](https://twitter.com/jenlooper)
- [Vidushi Gupta](https://github.com/Vidushi-Gupta)
- [Jasleen Sondhi](https://github.com/jasleen101010)
|
### クレジット
これらのビジュアライゼーションレッスンは、[Jen Looper](https://twitter.com/jenlooper)、[Jasleen Sondhi](https://github.com/jasleen101010)、[Vidushi Gupta](https://github.com/Vidushi-Gupta) によって🌸作成されました。
🍯 アメリカのハチミツ生産に関するデータは、[Jessica Li](https://www.kaggle.com/jessicali9530/honey-production)のプロジェクトから取得されました。この[データ](https://usda.library.cornell.edu/concern/publications/rn301137d)は、[アメリカ農務省](https://www.nass.usda.gov/About_NASS/index.php)から派生したものです。
🍄 キノコに関するデータは、[Hatteras Dunton](https://www.kaggle.com/hatterasdunton/mushroom-classification-updated-dataset)によって改訂された[データセット](https://www.kaggle.com/hatterasdunton/mushroom-classification-updated-dataset)から取得されました。このデータセットには、Agaricus属とLepiota属に属する23種のひだのあるキノコの仮想サンプルの説明が含まれています。データは『The Audubon Society Field Guide to North American Mushrooms (1981)』から引用され、1987年にUCI ML 27に寄贈されました。
🦆 ミネソタ州の鳥に関するデータは、[Hannah Collins](https://www.kaggle.com/hannahcollins/minnesota-birds)によって[Wikipedia](https://en.wikipedia.org/wiki/List_of_birds_of_Minnesota)からスクレイピングされたものです。
これらのデータセットはすべて[CC0: Creative Commons](https://creativecommons.org/publicdomain/zero/1.0/)としてライセンスされています。
**免責事項**:
この文書は、AI翻訳サービス [Co-op Translator](https://github.com/Azure/co-op-translator) を使用して翻訳されています。正確性を追求しておりますが、自動翻訳には誤りや不正確な部分が含まれる可能性があることをご承知ください。元の言語で記載された文書が正式な情報源とみなされるべきです。重要な情報については、専門の人間による翻訳を推奨します。この翻訳の使用に起因する誤解や誤解釈について、当社は責任を負いません。